Exam 22: Statistical Inference: Conclusion
Exam 1: What Is Statistics14 Questions
Exam 2: Types of Data, Data Collection and Sampling16 Questions
Exam 3: Graphical Descriptive Methods Nominal Data19 Questions
Exam 4: Graphical Descriptive Techniques Numerical Data64 Questions
Exam 5: Numerical Descriptive Measures147 Questions
Exam 6: Probability106 Questions
Exam 7: Random Variables and Discrete Probability Distributions55 Questions
Exam 8: Continuous Probability Distributions117 Questions
Exam 9: Statistical Inference: Introduction8 Questions
Exam 10: Sampling Distributions65 Questions
Exam 11: Estimation: Describing a Single Population127 Questions
Exam 12: Estimation: Comparing Two Populations22 Questions
Exam 13: Hypothesis Testing: Describing a Single Population129 Questions
Exam 14: Hypothesis Testing: Comparing Two Populations78 Questions
Exam 15: Inference About Population Variances49 Questions
Exam 16: Analysis of Variance115 Questions
Exam 17: Additional Tests for Nominal Data: Chi-Squared Tests110 Questions
Exam 18: Simple Linear Regression and Correlation213 Questions
Exam 19: Multiple Regression121 Questions
Exam 20: Model Building92 Questions
Exam 21: Nonparametric Techniques126 Questions
Exam 22: Statistical Inference: Conclusion103 Questions
Exam 23: Time-Series Analysis and Forecasting145 Questions
Exam 24: Index Numbers25 Questions
Exam 25: Decision Analysis51 Questions
Select questions type
A statistics course at a large university is taught in each semester. A student has noticed that the students in semester 1 and semester 2 are enrolled in different degrees. To investigate, the student takes a random sample of 25 students from semester 1 and 25 students from semester 2 and records their final marks (%) provided in the table below. Excel was used to generate descriptive statistics on each sample.
Assume that student final marks are normally distributed in each semester. 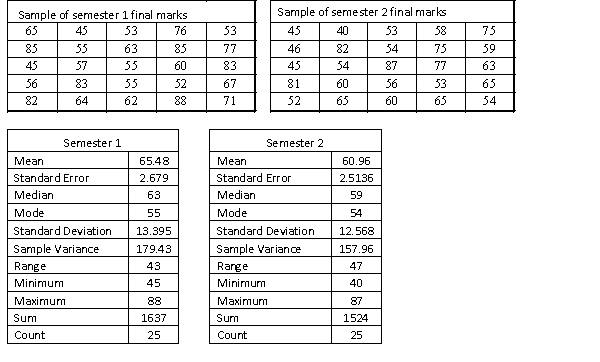 Can we conclude at the 5% significance level that the variance of semester 2 student's final marks is greater than 150?
(Essay)
4.8/5  (42)
(42)
In testing the difference between two population means using two independent samples, the population standard deviations are assumed to be known and the calculated test statistic equals 1.05. If the test is upper-tail and the 10% level of significance has been specified, the conclusion should be to:
(Multiple Choice)
4.9/5 (33)
In testing the difference between two population means for which the population variances are unknown and assumed to be equal, two independent samples are drawn from the populations. Which of the following tests is appropriate?
(Multiple Choice)
5.0/5 (33)
Which of the following is a required condition for using the normal approximation to the binomial in constructing interval estimate for the difference between two population proportions?
(Multiple Choice)
4.8/5 (35)
A statistics course at a large university is taught in each semester. A student has noticed that the students in semester 1 and semester 2 are enrolled in different degrees. To investigate, the student takes a random sample of 25 students from semester 1 and 25 students from semester 2 and records their final marks (%) provided in the table below. Excel was used to generate descriptive statistics on each sample.
Assume that student final marks are normally distributed in each semester. 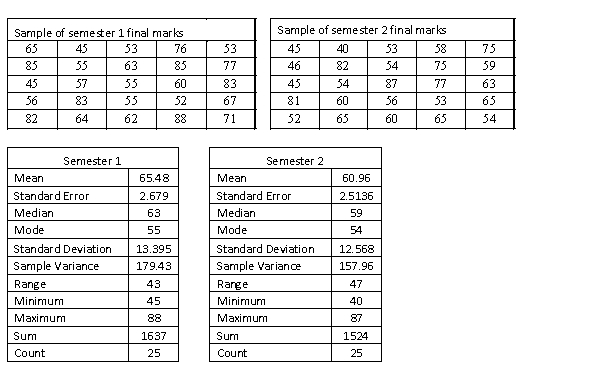 Can we conclude at the 5% significance level that the variance of semester 1 student's final marks is greater than 150?
(Essay)
4.9/5 (31)
In testing for the equality of two population variances, when the populations are normally distributed, the 5% level of significance has been used. To determine the rejection region, it will be necessary to refer to the F table corresponding to an upper-tail area of:
(Multiple Choice)
4.9/5 (37)
If a sample has 25 observations and a 99% confidence estimate for is needed, the appropriate t-score is 2.797.
(True/False)
5.0/5 (31)
In testing the hypotheses: , at the 10% significance level, if the sample proportion is 0.56, and the standard error of the sample proportion is 0.025, the appropriate conclusion is:
(Multiple Choice)
4.7/5 (33)
A statistics course at a large university is taught in each semester. A student has noticed that the students in semester 1 and semester 2 are enrolled in different degrees. To investigate, the student takes a random sample of 25 students from semester 1 and 25 students from semester 2 and records their final marks (%) provided in the table below. Excel was used to generate descriptive statistics on each sample.
Assume that student final marks are normally distributed in each semester. 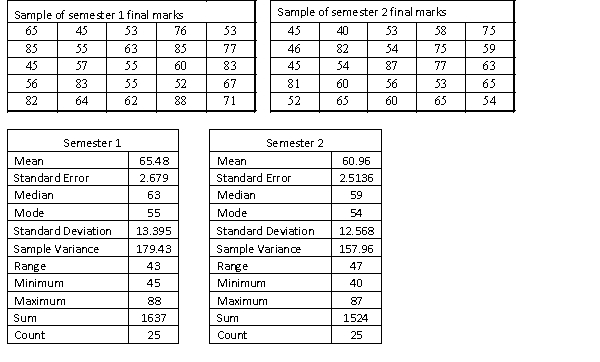 Estimate and interpret a 95% confidence interval for the population average final mark for semester 1 students.
(Essay)
4.8/5 (32)
The irradiation of food to destroy bacteria is an increasingly common practice. In order to determine which one of two methods of irradiation is best, a scientist took a random sample of 100 one-kilogram packages of minced meat and subjected 50 of them to irradiation method 1 and the remaining 50 to irradiation method 2. The bacteria counts were measured and the following statistics were computed. The scientist noted that the data were normally distributed. Method 1 Method 2 =86 =98 =324 =841 An important factor in determining which method to choose is consistency. That is, all other things being equal, we would prefer to have a method that leaves all irradiated food with approximately the same bacteria count. Can we infer at the 5% significance level that method 1 is superior to method 2 in this respect?
(Essay)
4.8/5 (27)
There are different approaches to fitness training. To judge which one of two approaches is better, 200 25-year-old men were randomly selected to participate in an experiment. For four weeks, 100 men were trained according to approach 1 while the other 100 men were trained according to approach 2. The percentage improvement in fitness was measured for each man and the statistics shown below were computed. The percentage figures are known to be normally distributed. Approach 1 Approach 2 =27.3 =33.6 =47.614 =28.09 Estimate with 95% confidence the difference in the mean percentage improvement between approaches 1 and 2, and briefly describe what this interval estimate tells you.
(Essay)
4.8/5 (30)
A random sample of 30 observations is selected from a normally distributed population. The sample variance is 12. In the 90% confidence interval for the population variance, the upper limit will be:
(Multiple Choice)
4.8/5 (32)
A sample of size 200 from population 1 has 50 successes. A sample of size 200 from population 2 has 40 successes. The value of the test statistic for testing the null hypothesis that the proportion of successes in population 1 exceeds the proportion of successes in population 2 by 0.025 is:
(Multiple Choice)
4.9/5 (28)
A one-tail test of the population proportion produces a test statistic z = -2.12. The p-value of the test is 0.034.
(True/False)
4.9/5 (36)
Videocassette recorder (VCR) tapes are designed so that users can repeatedly record new material over old material. However, after a number of re-recordings the tape begins to deteriorate. A VCR tape manufacturer is experimenting with a new technology, which hopefully will produce longer-lasting tapes. Thirty of the old-style tapes and 30 utilising the new technology were used in an experiment. The tapes were used to record and re-record programs until they began to deteriorate. The number of re-recordings is assumed to be normally distributed. It is generally accepted that the number of re-recordings should exceed 55. Any tapes that do not meet this criterion are considered to be unacceptable. The number of re-recordings were observed and shown in the accompanying table. Old-style tapes New-technology tapes 60 61 48 68 70 58 51 46 66 74 72 69 66 63 61 77 73 49 73 55 71 59 66 61 71 49 76 52 58 59 47 56 55 66 51 49 60 62 64 62 59 57 52 51 63 51 56 66 64 68 52 50 55 76 47 55 58 63 68 78 Estimate with 90% confidence the proportion of unacceptable old tapes, and briefly describe what this interval estimate tells you.
(Essay)
4.8/5 (36)
A sample of size 125 selected from one population has 55 successes, and a sample of size 140 selected from a second population has 70 successes. The test statistic for testing the equality of the population proportions is equal to:
(Multiple Choice)
4.9/5 (35)
There are different approaches to fitness training. To judge which one of two approaches is better, 200 25-year-old men were randomly selected to participate in an experiment. For four weeks, 100 men were trained according to approach 1 while the other 100 men were trained according to approach 2. The percentage improvement in fitness was measured for each man and the statistics shown below were computed. The percentage figures are known to be normally distributed. Approach 1 Approach 2 =27.3 =33.6 =47.614 =28.09 Determine whether these data are sufficient to infer at the 5% significance level that the two population variances differ.
(Essay)
4.8/5 (27)
When the necessary conditions are met, a two-tail test is being conducted to test the difference between two population means, but your statistical software provides only a one-tail area of 0.0327 as part of its output. The p-value for this test will be 0.0654.
(True/False)
4.9/5 (25)
With hypothesis testing, there are only two types of errors: Type I error where we incorrectly reject Ho and Type II error where we incorrectly retain Ho.
(True/False)
4.9/5 (32)
Filters
- Essay(0)
- Multiple Choice(0)
- Short Answer(0)
- True False(0)
- Matching(0)