Exam 4: Graphical Descriptive Techniques Numerical Data
Exam 1: What Is Statistics14 Questions
Exam 2: Types of Data, Data Collection and Sampling16 Questions
Exam 3: Graphical Descriptive Methods Nominal Data19 Questions
Exam 4: Graphical Descriptive Techniques Numerical Data64 Questions
Exam 5: Numerical Descriptive Measures147 Questions
Exam 6: Probability106 Questions
Exam 7: Random Variables and Discrete Probability Distributions55 Questions
Exam 8: Continuous Probability Distributions117 Questions
Exam 9: Statistical Inference: Introduction8 Questions
Exam 10: Sampling Distributions65 Questions
Exam 11: Estimation: Describing a Single Population127 Questions
Exam 12: Estimation: Comparing Two Populations22 Questions
Exam 13: Hypothesis Testing: Describing a Single Population129 Questions
Exam 14: Hypothesis Testing: Comparing Two Populations78 Questions
Exam 15: Inference About Population Variances49 Questions
Exam 16: Analysis of Variance115 Questions
Exam 17: Additional Tests for Nominal Data: Chi-Squared Tests110 Questions
Exam 18: Simple Linear Regression and Correlation213 Questions
Exam 19: Multiple Regression121 Questions
Exam 20: Model Building92 Questions
Exam 21: Nonparametric Techniques126 Questions
Exam 22: Statistical Inference: Conclusion103 Questions
Exam 23: Time-Series Analysis and Forecasting145 Questions
Exam 24: Index Numbers25 Questions
Exam 25: Decision Analysis51 Questions
Select questions type
A stem-and-leaf display describes two-digit integers between 20 and 70. For one of the classes displayed, the row appears as 4 | 2 5 6. The numerical values being described are 42, 45 and 46.
(True/False)
4.8/5  (30)
(30)
Construct an ogive for the test grades for a university business statistics class, and estimate the proportion of grades that are between 80 and 90. 63 74 42 65 51 54 36 56 68 57 62 64 76 67 79 61 81 77 59 38 84 68 71 94 71 86 69 75 91 55 48 82 83 54 79 62 68 58 41 47
(Essay)
4.8/5 (35)
Which of the following is the sum of the relative frequencies for all classes?
(Multiple Choice)
4.9/5 (25)
A list of share prices of one Australian company, at the end of a trading day for the period of 30 trading days, would be an example of time-series data.
(True/False)
4.8/5 (28)
Construct a frequency distribution and relative frequency distribution for the test grades for a university business statistics class, data given in the following table. Use seven class intervals. 63 74 42 65 51 54 36 56 68 57 62 64 76 67 79 61 81 77 59 38 84 68 71 94 71 86 69 75 91 55 48 82 83 54 79 62 68 58 41 47
(Essay)
4.8/5 (31)
Which of the following best describes the modal class? A. The class with the largest number of observati ons. B. The class with the smallest number of observations. C. The class with the largest observati on in the data set. D. The dass with the smallest obsertation in the data set.
(Short Answer)
5.0/5 (37)
The number of faulty items returned to a manufacturer of electric goods in the last 15 years is as follows: Year No. of faulty items 1996 27 1997 35 1998 34 1999 39 2000 43 2001 42 2002 40 2003 41 2004 45 2005 47 2006 46 2007 50 2008 49 2009 52 2010 52 a. Construct a relative frequency bar chart for these data.
b. Construct a line chart.
(Essay)
4.8/5 (37)
With a line graph, the horizontal axis is stretched out to get a deceptive steeper slope.
(True/False)
4.8/5 (41)
The graphical format used to display the relationship between two numerical (quantitative) variables is the scatter diagram.
(True/False)
4.9/5 (30)
The lowest value in a set of data is 140, and the largest value is 270. If the resulting frequency distribution is to have ten classes of equal width, the common class width will be 27.
(True/False)
4.9/5 (36)
Individual observations within each class may be found in a frequency distribution.
(True/False)
4.9/5 (32)
Which of the following may be determined from the height of the bar in a relative frequency histogram?
(Multiple Choice)
4.9/5 (41)
A list of share prices of 20 Australian companies at the end of a trading day would be an example of time-series data.
(True/False)
4.7/5 (38)
Graphical deception is acceptable when the graph displays what the statistician would like the reader to believe, as opposed to the truth about the data.
(True/False)
4.9/5 (36)
A relative frequency distribution describes the number of data values that fall within each class, and may be presented in histogram form.
(True/False)
4.8/5 (36)
The strength of a linear relationship between two numerical variables may be illustrated by a line graph, where the closer the points form a line, the stronger the linear relationship between the two variables.
(True/False)
4.9/5 (30)
The table below shows the number of licensed hotels with at least 15 rooms in New South Wales from March 1998 to December 2009. 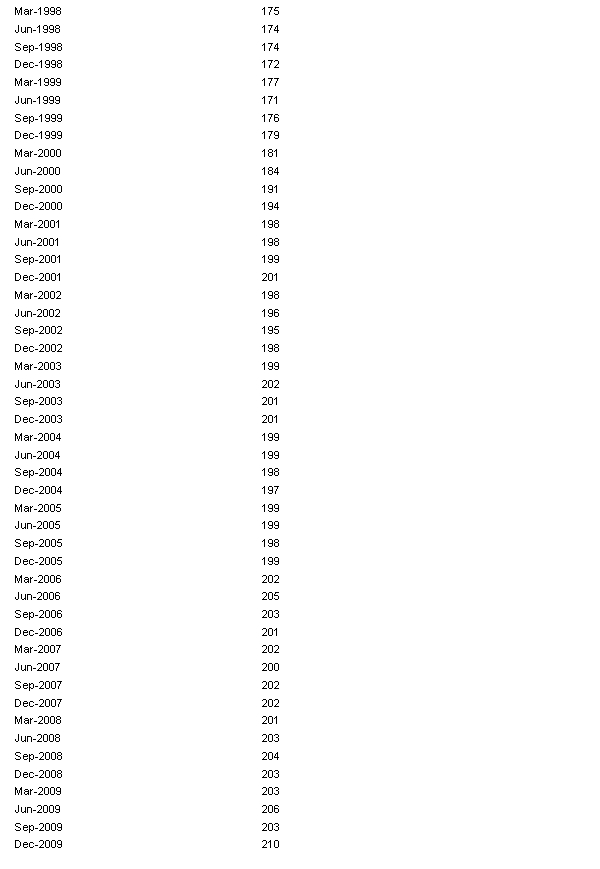 a. Plot the time series.
b. When did the number of licensed hotels with at least 15 rooms in New South Wales grow fastest?
a. Plot the time series.
b. When did the number of licensed hotels with at least 15 rooms in New South Wales grow fastest?
(Essay)
4.8/5 (37)
Consider the following cumulative frequency distribution. Class limits Cumulative frequency Up to 10 12 Up to 20 29 Up to 30 57 Up to 40 71 Up to 50 95 Find the frequency for each of the following classes.
a. 0 up to 10.
b. 10 up to 20.
c. 20 up to 30.
d. 30 up to 40.
e. 40 up to 50.
(Short Answer)
4.9/5 (33)
Filters
- Essay(0)
- Multiple Choice(0)
- Short Answer(0)
- True False(0)
- Matching(0)