Exam 2: Descriptive Statistics: Tabular and Graphical Displays
Exam 1: Data and Statistics84 Questions
Exam 2: Descriptive Statistics: Tabular and Graphical Displays67 Questions
Exam 3: Descriptive Statistics: Numerical Measures118 Questions
Exam 4: Introduction to Probability94 Questions
Exam 5: Discrete Probability Distributions84 Questions
Exam 6: Continuous Probability Distributions121 Questions
Exam 7: Sampling and Sampling Distributions116 Questions
Exam 8: Interval Estimation90 Questions
Exam 9: Hypothesis Tests95 Questions
Exam 10: Inference About Means and Proportions With Two Populations63 Questions
Exam 11: Inferences About Population Variances66 Questions
Exam 12: Comparing Multiple Proportions, Tests of Independence and Goodness of Fit59 Questions
Exam 13: Experimental Design and Analysis of Variance76 Questions
Exam 14: Simple Linear Regression132 Questions
Exam 15: Multiple Regression103 Questions
Exam 16: Regression Analysis: Model Building41 Questions
Exam 17: Time Series Analysis and Forecasting51 Questions
Exam 18: Nonparametric Methods58 Questions
Exam 19: Decision Analysis48 Questions
Exam 20: Index Numbers39 Questions
Exam 21: Statistical Methods for Quality Control60 Questions
Exam 22: Sample Survey48 Questions
Select questions type
The numbers of hours worked (per week) by 400 statistics students are shown below. 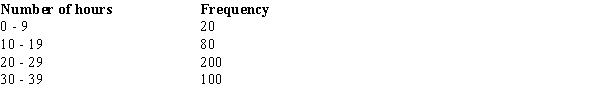 The cumulative percent frequency for < 29 hours is
(Multiple Choice)
4.7/5  (33)
(33)
A graphical device for depicting categorical data that have been summarized in a frequency distribution, relative frequency distribution, or percent frequency distribution is a
(Multiple Choice)
4.9/5 (32)
Fifteen percent of the students in a school of Business Administration are majoring in Economics, 20% in Finance, 35% in Management, and 30% in Accounting. The graphical device(s) which can be used to present these data is (are)
(Multiple Choice)
4.9/5 (40)
The numbers of hours worked on homework (per week) by 400 statistics students are shown below. 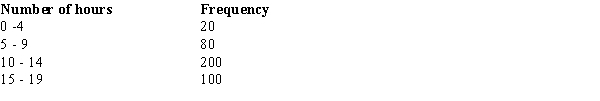 The class width used in this frequency distribution is
(Multiple Choice)
4.8/5 (34)
Before drawing any conclusions about the relationship between two variables shown in a crosstabulation, you should
(Multiple Choice)
4.9/5 (36)
The proper way to construct a stem-and-leaf display for the data set {62, 67, 68, 73, 73, 79, 91, 94, 95, 97} is to
(Multiple Choice)
4.9/5 (40)
The sales records of a real estate company for the month of May shows the following house prices (rounded to the nearest $1,000). Values are in thousands of dollars. 
a.
Develop a frequency distribution and a percent frequency distribution for the house prices. (Use 5 classes and have your first class be 20 - 39.)
b.
Develop a cumulative frequency and a cumulative percent frequency distribution for the above data.
c.
What percentage of the houses are sold at a price below $80,000?
(Essay)
4.7/5 (38)
Data that provide labels or names for categories of like items are known as _____ data.
(Multiple Choice)
4.9/5 (31)
A sample of 15 children shows their favorite kind of pet: 
Which of the following displays is most appropriate for this data?
Which of the following displays is most appropriate for this data?
(Multiple Choice)
4.9/5 (38)
Thirty students in the School of Business were asked what their majors were. The following represents their responses (M = Management; A = Accounting; E = Economics; O = Others). 
a.
Construct a frequency distribution and a bar chart.
b.
Construct a relative frequency distribution and a pie chart.
a.
Construct a frequency distribution and a bar chart.
b.
Construct a relative frequency distribution and a pie chart.
(Essay)
4.8/5 (28)
If several frequency distributions are constructed from the same data set, the distribution with the widest class width will have the
(Multiple Choice)
4.8/5 (43)
Which of the following graphical methods shows the relationship between two variables?
(Multiple Choice)
4.8/5 (43)
For stem-and-leaf displays where the leaf unit is not stated, the leaf unit is assumed to equal
(Multiple Choice)
5.0/5 (42)
In a cumulative relative frequency distribution, the last class will have a cumulative relative frequency equal to
(Multiple Choice)
4.7/5 (41)
In a cumulative frequency distribution, the last class will always have a cumulative frequency equal to
(Multiple Choice)
4.9/5 (39)
Histograms based on data on housing prices and salaries typically are
(Multiple Choice)
4.8/5 (34)
The most common graphical presentation of quantitative data is a
(Multiple Choice)
4.8/5 (34)
Which of the following is a graphical summary of a set of data in which each data value is represented by a dot above the axis?
(Multiple Choice)
4.8/5 (33)
Filters
- Essay(0)
- Multiple Choice(0)
- Short Answer(0)
- True False(0)
- Matching(0)