Exam 2: Descriptive Statistics: Tabular and Graphical Displays
Exam 1: Data and Statistics84 Questions
Exam 2: Descriptive Statistics: Tabular and Graphical Displays67 Questions
Exam 3: Descriptive Statistics: Numerical Measures118 Questions
Exam 4: Introduction to Probability94 Questions
Exam 5: Discrete Probability Distributions84 Questions
Exam 6: Continuous Probability Distributions121 Questions
Exam 7: Sampling and Sampling Distributions116 Questions
Exam 8: Interval Estimation90 Questions
Exam 9: Hypothesis Tests95 Questions
Exam 10: Inference About Means and Proportions With Two Populations63 Questions
Exam 11: Inferences About Population Variances66 Questions
Exam 12: Comparing Multiple Proportions, Tests of Independence and Goodness of Fit59 Questions
Exam 13: Experimental Design and Analysis of Variance76 Questions
Exam 14: Simple Linear Regression132 Questions
Exam 15: Multiple Regression103 Questions
Exam 16: Regression Analysis: Model Building41 Questions
Exam 17: Time Series Analysis and Forecasting51 Questions
Exam 18: Nonparametric Methods58 Questions
Exam 19: Decision Analysis48 Questions
Exam 20: Index Numbers39 Questions
Exam 21: Statistical Methods for Quality Control60 Questions
Exam 22: Sample Survey48 Questions
Select questions type
A frequency distribution is a tabular summary of data showing the _____ of items in several classes.
(Multiple Choice)
4.8/5  (32)
(32)
A survey of 800 college seniors resulted in the following crosstabulation regarding their undergraduate major and whether or not they plan to go to graduate school. 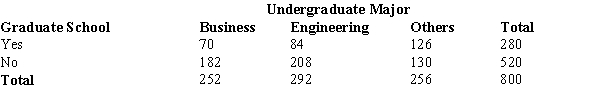 Of those students who are planning on going to graduate school, what percentage are majoring in engineering?
(Multiple Choice)
4.8/5 (34)
The sum of the relative frequencies for all classes will always equal
(Multiple Choice)
4.8/5 (34)
A graphical presentation of the relationship between two quantitative variables is
(Multiple Choice)
4.9/5 (42)
A survey of 800 college seniors resulted in the following crosstabulation regarding their undergraduate major and whether or not they plan to go to graduate school.  Of those students who are majoring in engineering, what percentage plans to go to graduate school?
(Multiple Choice)
4.9/5 (42)
Filters
- Essay(0)
- Multiple Choice(0)
- Short Answer(0)
- True False(0)
- Matching(0)