Exam 2: Descriptive Statistics: Tabular and Graphical Displays
Exam 1: Data and Statistics84 Questions
Exam 2: Descriptive Statistics: Tabular and Graphical Displays67 Questions
Exam 3: Descriptive Statistics: Numerical Measures118 Questions
Exam 4: Introduction to Probability94 Questions
Exam 5: Discrete Probability Distributions84 Questions
Exam 6: Continuous Probability Distributions121 Questions
Exam 7: Sampling and Sampling Distributions116 Questions
Exam 8: Interval Estimation90 Questions
Exam 9: Hypothesis Tests95 Questions
Exam 10: Inference About Means and Proportions With Two Populations63 Questions
Exam 11: Inferences About Population Variances66 Questions
Exam 12: Comparing Multiple Proportions, Tests of Independence and Goodness of Fit59 Questions
Exam 13: Experimental Design and Analysis of Variance76 Questions
Exam 14: Simple Linear Regression132 Questions
Exam 15: Multiple Regression103 Questions
Exam 16: Regression Analysis: Model Building41 Questions
Exam 17: Time Series Analysis and Forecasting51 Questions
Exam 18: Nonparametric Methods58 Questions
Exam 19: Decision Analysis48 Questions
Exam 20: Index Numbers39 Questions
Exam 21: Statistical Methods for Quality Control60 Questions
Exam 22: Sample Survey48 Questions
Select questions type
The difference between consecutive lower class or upper class limits of adjacent classes provides the
(Multiple Choice)
4.9/5  (30)
(30)
A sample of the class sizes of 10 statistics classes at a university is shown below. 
Construct a dot plot for the above data.
Construct a dot plot for the above data.
(Essay)
4.9/5 (39)
The test scores of 14 individuals on their first statistics examination are shown below. 
Construct a stem-and-leaf display for these data.
Construct a stem-and-leaf display for these data.
(Essay)
4.8/5 (38)
Which of the following is not a recommended guideline for creating an effective graphical display?
(Multiple Choice)
4.9/5 (33)
In a cumulative percent frequency distribution, the last class will have a cumulative percent frequency equal to
(Multiple Choice)
4.8/5 (23)
In a scatter diagram, a line that provides an approximation of the relationship between the variables is known as a _____ line.
(Multiple Choice)
4.9/5 (37)
A researcher is gathering data from four geographical areas designated: South = 1; North = 2; East = 3; West =4. The designated geographical regions represent?
(Multiple Choice)
4.8/5 (39)
A graphical method that can be used to show both the rank order and shape of a distribution of data simultaneously is a
(Multiple Choice)
4.9/5 (33)
The numbers of hours worked (per week) by 400 statistics students are shown below.  The midpoint of the third class is
(Multiple Choice)
4.8/5 (31)
The following data set shows the number of hours of sick leave that some of the employees of Bastien's, Inc. have taken during the first quarter of the year (rounded to the nearest hour). 
a.
Develop a frequency distribution for the above data. (Let the width of your classes be 10 units and start your first class as 10 - 19.)
b.
Develop a relative frequency distribution and a percent frequency distribution for the data.
c.
Develop a cumulative frequency distribution.
d.
How many employees have taken less than 40 hours of sick leave?
(Essay)
4.9/5 (34)
The numbers of hours worked (per week) by 400 statistics students are shown below. 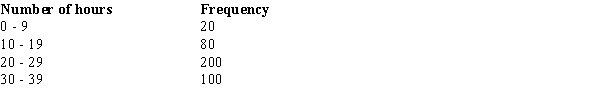 The relative frequency of students working 0 - 9 hours per week is
(Multiple Choice)
4.9/5 (26)
A sample of fifteen 7-year old boys shows their favorite superheroes: 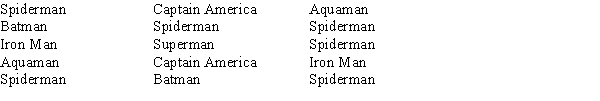 Which of the following is the correct frequency distribution?
(Multiple Choice)
4.8/5 (37)
The approximate class width for a frequency distribution involving quantitative data can be determined using the expression
(Multiple Choice)
4.9/5 (41)
A sample of 15 children shows their favorite kind of pet: 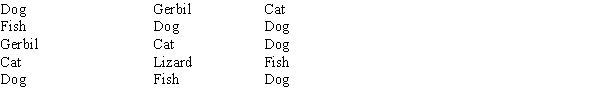
Which of the following distributions would be inappropriate for this data?
Which of the following distributions would be inappropriate for this data?
(Multiple Choice)
4.8/5 (42)
There are 800 students in the School of Business Administration. There are four majors in the School: Accounting, Finance, Management, and Marketing. The following shows the number of students in each major.  Develop a percent frequency distribution and construct a bar chart and a pie chart.
(Essay)
4.8/5 (43)
The numbers of hours worked (per week) by 400 statistics students are shown below.  The percentage of students who work at least 20 hours per week is
(Multiple Choice)
4.7/5 (36)
You are given the following data on the age of employees at a company. Construct a stem-and-leaf display. 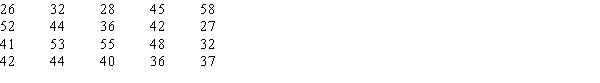
(Essay)
4.9/5 (40)
Which of the following types of data cannot be appropriately displayed by a histogram?
(Multiple Choice)
4.8/5 (38)
A graphical tool typically associated with the display of key performance indicators is a
(Multiple Choice)
4.9/5 (35)
Filters
- Essay(0)
- Multiple Choice(0)
- Short Answer(0)
- True False(0)
- Matching(0)