Exam 21: The Theory of Consumer Choice
Exam 1: Ten Principles of Economics455 Questions
Exam 2: Thinking Like an Economist645 Questions
Exam 3: Interdependence and the Gains From Trade550 Questions
Exam 4: The Market Forces of Supply and Demand693 Questions
Exam 5: Elasticity and Its Application625 Questions
Exam 6: Supply, Demand, and Government Policies671 Questions
Exam 7: Consumers, Producers, and the Efficiency of Markets547 Questions
Exam 8: Application: The Costs of Taxation507 Questions
Exam 9: Application: International Trade521 Questions
Exam 10: Externalities543 Questions
Exam 11: Public Goods and Common Resources453 Questions
Exam 12: The Design of the Tax System563 Questions
Exam 13: The Costs of Production649 Questions
Exam 14: Firms in Competitive Markets608 Questions
Exam 15: Monopoly662 Questions
Exam 16: Monopolistic Competition649 Questions
Exam 17: Oligopoly522 Questions
Exam 18: The Markets for the Factors of Production592 Questions
Exam 19: Earnings and Discrimination511 Questions
Exam 20: Income Inequality and Poverty478 Questions
Exam 21: The Theory of Consumer Choice568 Questions
Exam 22: Frontiers in Microeconomics461 Questions
Select questions type
A consumer's budget constraint is drawn with the quantity of pizza measured along the horizontal axis and the price of Pepsi measured along the vertical axis. If the market is offering the consumer the trade-off of 3 pints of Pepsi for 1 pizza, then what is the slope of the consumer's budget constraint?
(Essay)
4.8/5  (29)
(29)
Economic studies of lottery winners and people who have inherited large amounts of money show that
(Multiple Choice)
4.9/5 (37)
A family on a trip budgets $800 for meals and gasoline. If the price of a meal for the family is $50, how many meals can the family buy if they do not buy any gasoline?
(Multiple Choice)
4.9/5 (39)
Figure 21-20
The following graph illustrates a representative consumer's preferences for marshmallows and chocolate chip cookies: 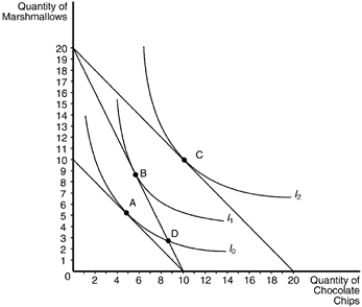 -Refer to Figure 21-20. Assume that the consumer depicted the figure has an income of $50. Based on the information available in the graph, which of the following price-quantity combinations would be on her demand curve for chocolate chips if the price of marshmallows is $2.50?
(Multiple Choice)
4.9/5 (29)
Figure 21-31 The figure shows two indifference curves and two budget constraints for a consumer named Kevin. 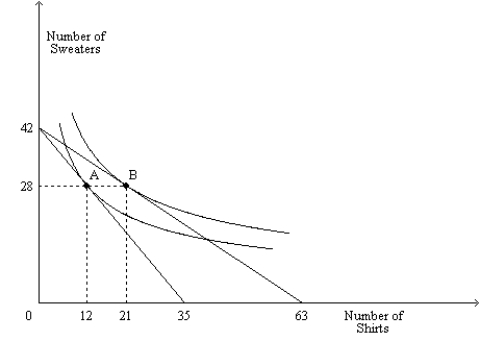 -Refer to Figure 21-31. Suppose Kevin is optimally purchasing 12 shirts and 28 sweaters, and he is spending $648 on shirts. What is the price of a sweater?
(Essay)
4.7/5 (38)
Jerry consumes two goods, hamburgers and ice cream sandwiches. He has maximized his utility given his income. Ice cream sandwiches costs $2, and he consumes them to the point where the marginal utility he receives is 6. Hamburgers cost $4, and the relationship between the marginal utility that Jerry gets from eating hamburgers and the number he eats per month is as follows:  How many hamburgers does Jerry buy each month?
(Multiple Choice)
4.8/5 (36)
Figure 21-32 The figure shows three indifference curves and a budget constraint for a consumer named Hannah. When young, Hannah works and earns income. When old, she is retired and earns no income. 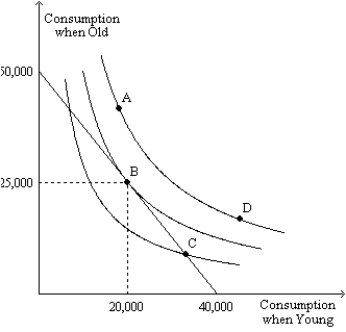 -Refer to Figure 21-32. From the figure we can determine how much income Hannah earns when young and we can determine the interest rate. Could the interest rate rise to a level at which Hannah could afford to be at point A?
(Essay)
4.8/5 (27)
Figure 21-10 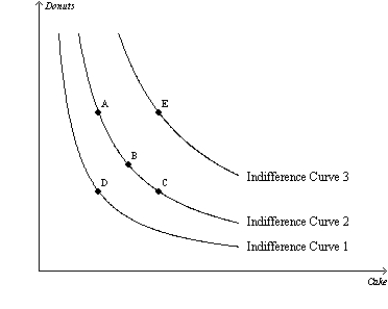 -Refer to Figure 21-10. When comparing bundle A to bundle E, the consumer
(Multiple Choice)
4.9/5 (41)
Figure 21-25 The figure pertains to a particular consumer. On the axes, X represents the quantity of good X and Y represents the quantity of good Y. 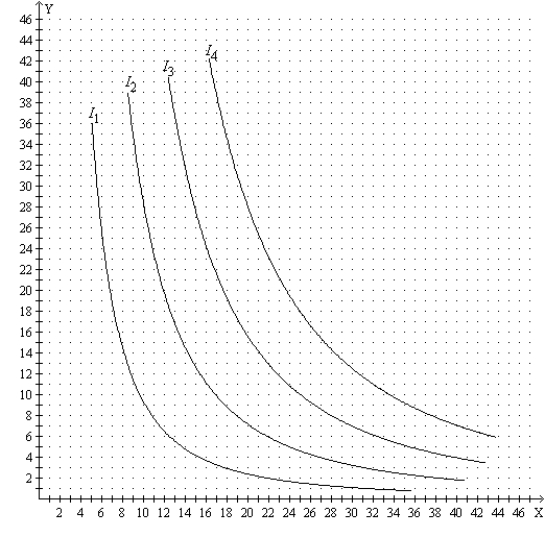 -Refer to Figure 21-25. Suppose the price of good X is $8, the price of good Y is $10, and the consumer's income is $360. Then the consumer's optimal choice is represented by a point on which curve?
(Multiple Choice)
4.9/5 (41)
For a typical consumer, indifference curves can intersect if they satisfy the property of transitivity.
(True/False)
4.8/5 (40)
The relationship between the marginal utility that Casey gets from eating ice cream sundaes and the number of ice cream cones he eats per week is as follows:  Casey receives 3 units of utility from the last dollar spent on each of the other goods he consumes. If ice cream sundaes cost $4 each, how many ice cream sundaes will he consume per month if he maximizes utility?
(Multiple Choice)
4.8/5 (43)
Using indifference curves and budget constraints, graphically illustrate the substitution and income effect that would result from a change in the price of a normal good.
(Essay)
4.9/5 (34)
Scenario 21-3
Scott knows that he will ultimately face retirement. Assume that Scott will experience two periods in his life, one in which he works and earns income, and one in which he is retired and earns no income. Scott can earn $250,000 during his working period and nothing in his retirement period. He must both save and consume in his work period with an interest rate of 10 percent on savings.
-Refer to Scenario 21-3. If the interest rate on savings increases,
(Multiple Choice)
4.7/5 (34)
The income effect of an increase in the interest rate will result in an increase in consumption when
(Multiple Choice)
4.7/5 (43)
Figure 21-20
The following graph illustrates a representative consumer's preferences for marshmallows and chocolate chip cookies:
-Refer to Figure 21-20. Assume that the consumer has an income of $40. Based on the information available in the graph, which of the following price-quantity combinations would be on her demand curve for marshmallows if the price of chocolate chips were $4?
(Multiple Choice)
4.7/5 (43)
Filters
- Essay(0)
- Multiple Choice(0)
- Short Answer(0)
- True False(0)
- Matching(0)