Exam 21: The Theory of Consumer Choice
Exam 1: Ten Principles of Economics455 Questions
Exam 2: Thinking Like an Economist645 Questions
Exam 3: Interdependence and the Gains From Trade550 Questions
Exam 4: The Market Forces of Supply and Demand693 Questions
Exam 5: Elasticity and Its Application625 Questions
Exam 6: Supply, Demand, and Government Policies671 Questions
Exam 7: Consumers, Producers, and the Efficiency of Markets547 Questions
Exam 8: Application: The Costs of Taxation507 Questions
Exam 9: Application: International Trade521 Questions
Exam 10: Externalities543 Questions
Exam 11: Public Goods and Common Resources453 Questions
Exam 12: The Design of the Tax System563 Questions
Exam 13: The Costs of Production649 Questions
Exam 14: Firms in Competitive Markets608 Questions
Exam 15: Monopoly662 Questions
Exam 16: Monopolistic Competition649 Questions
Exam 17: Oligopoly522 Questions
Exam 18: The Markets for the Factors of Production592 Questions
Exam 19: Earnings and Discrimination511 Questions
Exam 20: Income Inequality and Poverty478 Questions
Exam 21: The Theory of Consumer Choice568 Questions
Exam 22: Frontiers in Microeconomics461 Questions
Select questions type
The income effect of a price change is the change in consumption that results from the movement to a new indifference curve.
(True/False)
4.7/5  (32)
(32)
A consumer's indifference curves are straight lines when, for the consumer, the goods in question are __________.
(Short Answer)
4.7/5 (36)
Energy drinks and granola bars are normal goods. When the price of energy drinks decreases, the income effect causes a
(Multiple Choice)
4.8/5 (30)
Figure 21-10 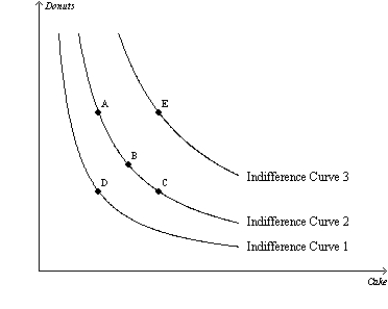 -Refer to Figure 21-10. Which of the following statements is not true for a consumer who moves from bundle B to bundle C?
(Multiple Choice)
4.8/5 (35)
Given a consumer's indifference map, the demand curve for a good can
(Multiple Choice)
4.9/5 (32)
A consumer maximizes utility at a point where multiple indifference curves intersect the budget line.
(True/False)
4.9/5 (37)
Katie wins $3 million in her state's lottery. If Katie drastically reduces the number of hours she works after she wins the money, we can infer that the income effect is larger than the substitution effect for her.
(True/False)
4.9/5 (25)
Assume that a consumer faces the following budget constraints. 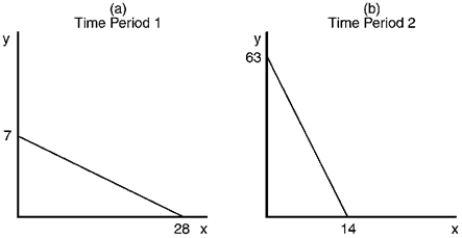 a.Assuming that income is the same on both occasions, describe the difference in relative prices between Panel A and Panel B.
b.If income in Panel B is $126, what is the price of good X?
c.If income in Panel A is $84, what is the price of good Y?
d.Assuming that the price of good X is the same on both occasions, describe the difference in income and price of good Y between Panel A and Panel B.
a.Assuming that income is the same on both occasions, describe the difference in relative prices between Panel A and Panel B.
b.If income in Panel B is $126, what is the price of good X?
c.If income in Panel A is $84, what is the price of good Y?
d.Assuming that the price of good X is the same on both occasions, describe the difference in income and price of good Y between Panel A and Panel B.
(Essay)
4.9/5 (30)
Figure 21-31 The figure shows two indifference curves and two budget constraints for a consumer named Kevin. 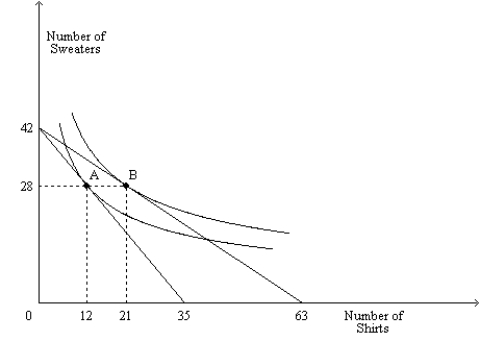 -Refer to Figure 21-31. If point A is Kevin's optimum, then at that optimum, what is his opportunity cost of a shirt in terms of sweaters?
(Essay)
4.9/5 (38)
Samantha is maximizing total utility while consuming food and clothing. Her marginal utility from food is 50, and her marginal utility from clothing is 25. If clothing is priced at $10 per unit, the price of food per unit must be
(Multiple Choice)
4.8/5 (42)
When a consumer experiences a price decrease for an inferior good, if the income effect is
(Multiple Choice)
4.9/5 (45)
Good X is an inferior good but not a Giffen good. When the price of X increases, the consumer will consume
(Multiple Choice)
4.7/5 (37)
Figure 21-3
In each case, the budget constraint moves from BC-1 to BC-2. 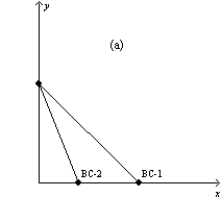
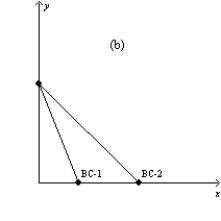
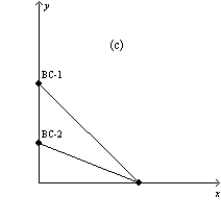
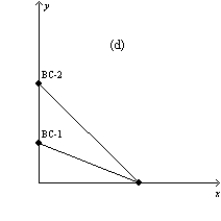 -Refer to Figure 21-3. Which of the graphs in the figure could reflect a simultaneous decrease in the price of good X and increase in the price of good Y? (i)
Graph a
(ii)
Graph b
(iii)
Graph c
(iv)
Graph d
-Refer to Figure 21-3. Which of the graphs in the figure could reflect a simultaneous decrease in the price of good X and increase in the price of good Y? (i)
Graph a
(ii)
Graph b
(iii)
Graph c
(iv)
Graph d
(Multiple Choice)
4.9/5 (41)
A consumer maximizes utility when she consumes at a point where
(Multiple Choice)
4.8/5 (47)
If Suzette responds to an increase in the interest rate by decreasing her saving, then, for Suzette,
(Multiple Choice)
4.9/5 (36)
Figure 21-23 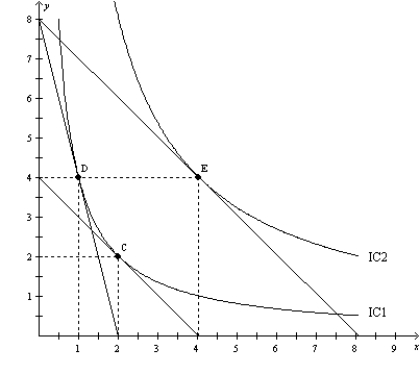 -Refer to Figure 21-23. When the price of X is $80, the price of Y is $20, and the consumer's income is $160, the consumer's optimal choice is D. Then the price of X decreases to $20. The substitution effect can be illustrated as the movement from
(Multiple Choice)
4.9/5 (31)
A budget constraint illustrates bundles that a consumer prefers equally, while an indifference curve illustrates bundles that are equally affordable to a consumer.
(True/False)
5.0/5 (37)
Filters
- Essay(0)
- Multiple Choice(0)
- Short Answer(0)
- True False(0)
- Matching(0)