Exam 21: The Theory of Consumer Choice
Exam 1: Ten Principles of Economics455 Questions
Exam 2: Thinking Like an Economist645 Questions
Exam 3: Interdependence and the Gains From Trade550 Questions
Exam 4: The Market Forces of Supply and Demand693 Questions
Exam 5: Elasticity and Its Application625 Questions
Exam 6: Supply, Demand, and Government Policies671 Questions
Exam 7: Consumers, Producers, and the Efficiency of Markets547 Questions
Exam 8: Application: The Costs of Taxation507 Questions
Exam 9: Application: International Trade521 Questions
Exam 10: Externalities543 Questions
Exam 11: Public Goods and Common Resources453 Questions
Exam 12: The Design of the Tax System563 Questions
Exam 13: The Costs of Production649 Questions
Exam 14: Firms in Competitive Markets608 Questions
Exam 15: Monopoly662 Questions
Exam 16: Monopolistic Competition649 Questions
Exam 17: Oligopoly522 Questions
Exam 18: The Markets for the Factors of Production592 Questions
Exam 19: Earnings and Discrimination511 Questions
Exam 20: Income Inequality and Poverty478 Questions
Exam 21: The Theory of Consumer Choice568 Questions
Exam 22: Frontiers in Microeconomics461 Questions
Select questions type
Bundle J contains 10 units of good X and 5 units of good Y. Bundle K contains 5 units of good X and 10 units of good Y. Bundle L contains 10 units of good X and 10 units of good Y. Assume that the consumer's preferences satisfy the four properties of indifference curves. The price of X is $1, the price of Y is $2, and the consumer has an income of $20. Which bundle will the consumer choose?
(Multiple Choice)
4.9/5  (34)
(34)
Scenario 21-1
Suppose the price of hot wings is $10, the price of beer is $1, and the consumer's income is $50. In addition, suppose the consumer's budget constraint illustrates hot wings on the horizontal axis and beer on the vertical axis.
-Refer to Scenario 21-1. If the consumer's income rises to $60, then the budget line for hot wings and beer would
(Multiple Choice)
4.9/5 (40)
At a consumer's optimal choice, the consumer chooses the combination of goods that equates the marginal rate of substitution and the price ratio.
(True/False)
4.8/5 (33)
When considering her budget, the highest indifference curve that a consumer can reach is the
(Multiple Choice)
4.8/5 (43)
Figure 21-3
In each case, the budget constraint moves from BC-1 to BC-2. 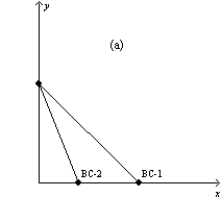
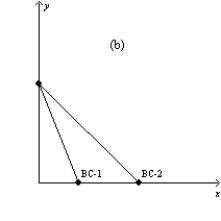
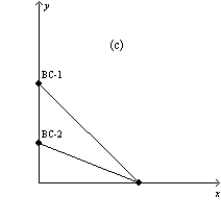
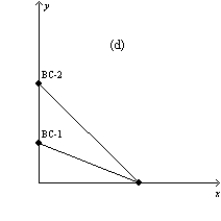 -Refer to Figure 21-3. Which of the graphs in the figure could reflect a simultaneous decrease in the prices of both goods? (i)
Graph a
(ii)
Graph b
(iii)
Graph c
(iv)
Graph d
-Refer to Figure 21-3. Which of the graphs in the figure could reflect a simultaneous decrease in the prices of both goods? (i)
Graph a
(ii)
Graph b
(iii)
Graph c
(iv)
Graph d
(Multiple Choice)
4.9/5 (37)
Figure 21-29
The figure below illustrates the preferences of a representative consumer, Nathaniel. 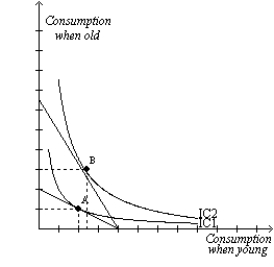 -Refer to Figure 21-29. A change in Nathaniel's optimum from point A to point B results from
(Multiple Choice)
4.9/5 (38)
Scenario 21-1
Suppose the price of hot wings is $10, the price of beer is $1, and the consumer's income is $50. In addition, suppose the consumer's budget constraint illustrates hot wings on the horizontal axis and beer on the vertical axis.
-Refer to Scenario 21-1. If the price of beer doubles to $2, then the
(Multiple Choice)
4.9/5 (39)
Figure 21-12 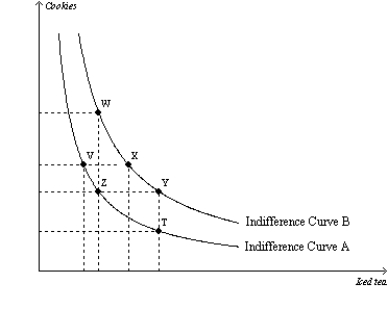 -Refer to Figure 21-12. The marginal rate of substitution between bundles V and Z is
(Multiple Choice)
4.8/5 (35)
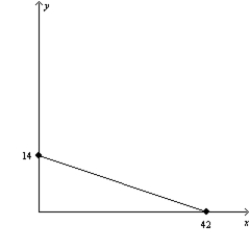
Figure 21-30 The graph shows two budget constraints for a consumer. 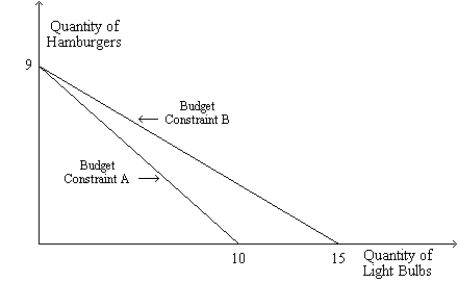 -Refer to Figure 21-30. Suppose the price of a hamburger is $10 and Budget Constraint A applies. What is the consumer's income? What is the price of a light bulb?
(Essay)
4.8/5 (31)
Figure 21-5
(a)
(b) 
 -Refer to Figure 21-5. In graph (b), if income is equal to $420, then the price of good X is
(Multiple Choice)
4.9/5 (32)
Figure 21-21 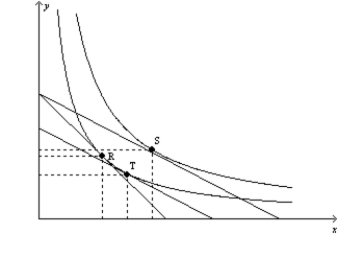 -Refer to Figure 21-21. Suppose that a consumer is originally at point R. Then the price of good X decreases. Which of the following represents the income effect of the price decrease?
(Multiple Choice)
4.9/5 (36)
Figure 21-32 The figure shows three indifference curves and a budget constraint for a consumer named Hannah. When young, Hannah works and earns income. When old, she is retired and earns no income. 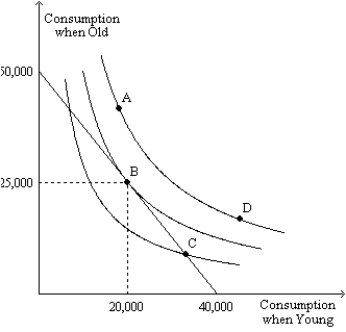 -Refer to Figure 21-32. From the figure we can determine how much income Hannah earns when young and we can determine the interest rate. Could the interest rate rise to a level at which Hannah could afford to be at point D?
(Essay)
4.8/5 (39)
Figure 21-15 On the graph, Qx represents the quantity of good x and Qy represents the quantity of good y. The lines drawn on the graph represent three of Barbara's indifference curves. 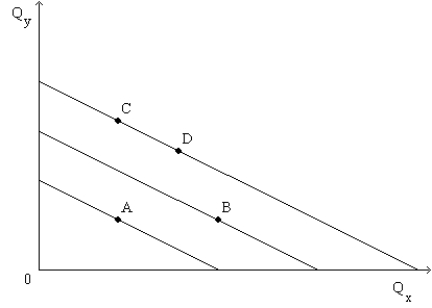 -Refer to Figure 21-15. For Barbara, the marginal rate of substitution between goods y and x
(Multiple Choice)
5.0/5 (30)
Jordan is planning ahead for retirement and must decide how much to spend and how much to save while he's working in order to have money to spend when he retires. When the income effect dominates the substitution effect, an increase in the interest rate on savings will cause him to
(Multiple Choice)
4.8/5 (38)
Figure 21-3
In each case, the budget constraint moves from BC-1 to BC-2.
-Refer to Figure 21-3. Which of the graphs in the figure reflects an increase in the price of good X only?
(Multiple Choice)
4.8/5 (38)
Which of the following statements is necessarily true regarding a point along a budget line?
(Multiple Choice)
4.8/5 (42)
Figure 21-25 The figure pertains to a particular consumer. On the axes, X represents the quantity of good X and Y represents the quantity of good Y. 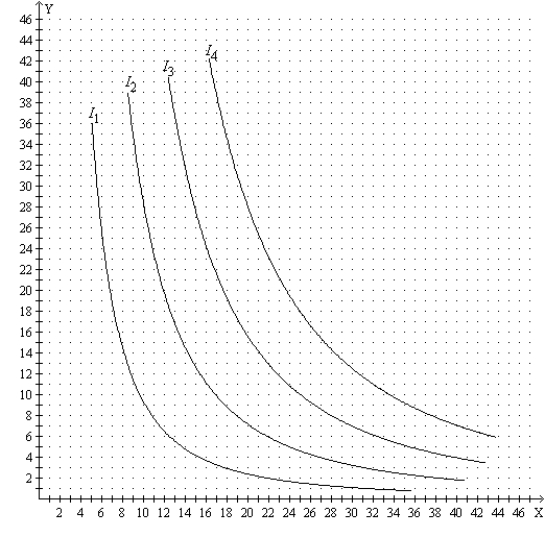 -Refer to Figure 21-25. Suppose the price of good X is $8, the price of good Y is $10, and the consumer's income is $360. Then the consumer's optimal choice is to buy
(Multiple Choice)
4.8/5 (31)
Suppose Caroline is indifferent between tea and coffee as long as she consumes an equivalent amount of caffeine. Suppose that coffee has twice as much caffeine as tea. Which graph would illustrate a representative indifference curve?
(Multiple Choice)
4.9/5 (41)
Filters
- Essay(0)
- Multiple Choice(0)
- Short Answer(0)
- True False(0)
- Matching(0)