Exam 21: The Theory of Consumer Choice
Exam 1: Ten Principles of Economics455 Questions
Exam 2: Thinking Like an Economist645 Questions
Exam 3: Interdependence and the Gains From Trade550 Questions
Exam 4: The Market Forces of Supply and Demand693 Questions
Exam 5: Elasticity and Its Application625 Questions
Exam 6: Supply, Demand, and Government Policies671 Questions
Exam 7: Consumers, Producers, and the Efficiency of Markets547 Questions
Exam 8: Application: The Costs of Taxation507 Questions
Exam 9: Application: International Trade521 Questions
Exam 10: Externalities543 Questions
Exam 11: Public Goods and Common Resources453 Questions
Exam 12: The Design of the Tax System563 Questions
Exam 13: The Costs of Production649 Questions
Exam 14: Firms in Competitive Markets608 Questions
Exam 15: Monopoly662 Questions
Exam 16: Monopolistic Competition649 Questions
Exam 17: Oligopoly522 Questions
Exam 18: The Markets for the Factors of Production592 Questions
Exam 19: Earnings and Discrimination511 Questions
Exam 20: Income Inequality and Poverty478 Questions
Exam 21: The Theory of Consumer Choice568 Questions
Exam 22: Frontiers in Microeconomics461 Questions
Select questions type
What is an individual's marginal rate of substitution between nickels and dollar bills? Assume the individual only cares about the monetary value of each bundle.
(Multiple Choice)
4.7/5  (42)
(42)
Figure 21-18 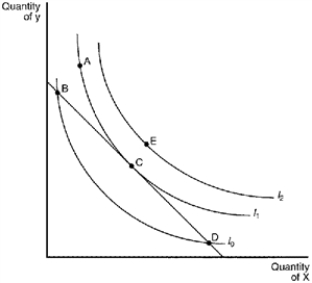 -Refer to Figure 21-18. Bundle B represents a point where
(Multiple Choice)
4.7/5 (37)
Figure 21-7 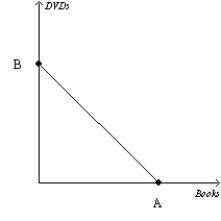 -Refer to Figure 21-7. Suppose a consumer has $200 in income, the price of a book is $5, and the price of a DVD is $10. What is the value of B?
(Multiple Choice)
4.8/5 (33)
Bundle L contains 10 units of good X and 20 units of good Y. Bundle M contains 8 units of good X and 21 units of good Y. The consumer is indifferent between bundle L and bundle M. Assume that the consumer's preferences satisfy the four properties of indifference curves. Which of the following correctly expresses the marginal rate of substitution of good X for good Y between these two points?
(Multiple Choice)
4.8/5 (27)
A good is an inferior good if the consumer buys more of it when
(Multiple Choice)
4.8/5 (37)
Figure 21-32 The figure shows three indifference curves and a budget constraint for a consumer named Hannah. When young, Hannah works and earns income. When old, she is retired and earns no income. 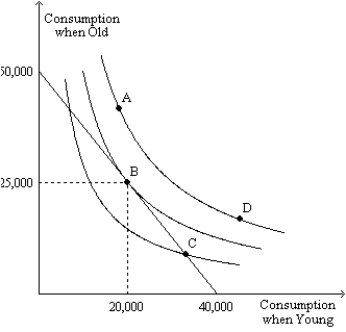 -Refer to Figure 21-32. At two of the four labeled points, Hannah is equally happy. Identify those two points.
(Short Answer)
4.8/5 (35)
Figure 21-14 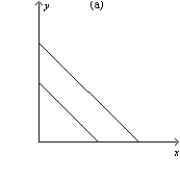
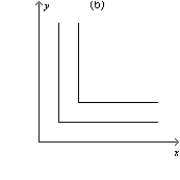
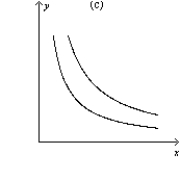 -Refer to Figure 21-14. Which of the graphs shown represent indifference curves for perfect complements?
(Multiple Choice)
4.8/5 (30)
If we observe that Jamie's budget constraint has moved outward, then we know for certain that
(Multiple Choice)
4.9/5 (37)
Higher indifference curves are preferred to lower ones as long as the
(Multiple Choice)
4.9/5 (38)
The bowed shape of the indifference curve reflects the consumer's
(Multiple Choice)
4.9/5 (30)
Figure 21-22 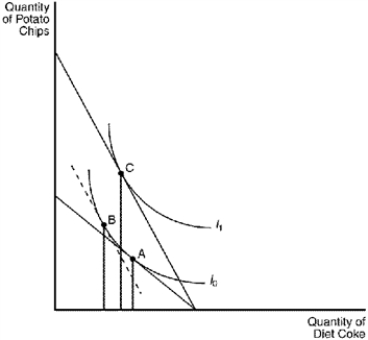 -Refer to Figure 21-22. If the consumer is currently at point A in the figure, a movement to point B as a result of a decrease in the price of potato chips represents the
(Multiple Choice)
4.9/5 (36)
"Left" gloves and "right" gloves provide a good example of
(Multiple Choice)
4.9/5 (31)
Suppose the price of good X falls and the consumption of good X increases. From this we can infer that X is a(n) (i)
Normal good.(ii)
Inferior good.(iii)
Giffen good.
(Multiple Choice)
4.8/5 (43)
Figure 21-2 The downward-sloping line on the figure represents a consumer's budget
constraint. 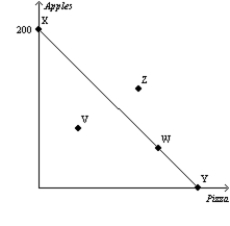 -Refer to Figure 21-2. If the consumer's income is $100, then what is the price of an apple?
(Multiple Choice)
4.8/5 (41)
If income decreases and prices are unchanged, the consumer's budget constraint
(Multiple Choice)
4.9/5 (34)
Consumers face tradeoffs except at the point where the indifference curve is tangent to the budget line.
(True/False)
4.8/5 (39)
A consumer's indifference curves are right angles when, for the consumer, the goods in question are __________.
(Short Answer)
4.8/5 (41)
Consider two goods: peanuts and crackers. The slope of the consumer's budget constraint is measured by the
(Multiple Choice)
4.9/5 (37)
Figure 21-3
In each case, the budget constraint moves from BC-1 to BC-2. 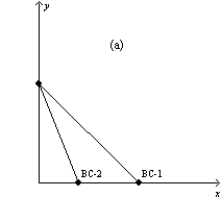
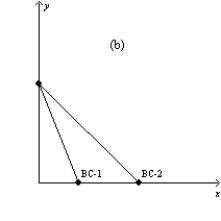
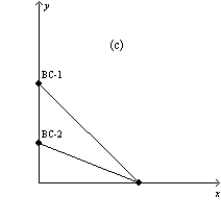
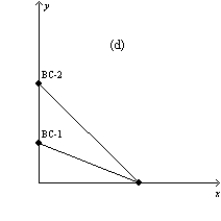 -Refer to Figure 21-3. Which of the graphs in the figure reflects an increase in the price of good Y only?
(Multiple Choice)
4.7/5 (33)
Thomas faces prices of $6 for a unit of good X and $30 for a unit of good Y. At his optimum, Thomas is willing to give up 1 unit of good Y for __________ units of good X.
(Short Answer)
4.9/5 (39)
Filters
- Essay(0)
- Multiple Choice(0)
- Short Answer(0)
- True False(0)
- Matching(0)