Exam 21: The Theory of Consumer Choice
Exam 1: Ten Principles of Economics455 Questions
Exam 2: Thinking Like an Economist645 Questions
Exam 3: Interdependence and the Gains From Trade550 Questions
Exam 4: The Market Forces of Supply and Demand693 Questions
Exam 5: Elasticity and Its Application625 Questions
Exam 6: Supply, Demand, and Government Policies671 Questions
Exam 7: Consumers, Producers, and the Efficiency of Markets547 Questions
Exam 8: Application: The Costs of Taxation507 Questions
Exam 9: Application: International Trade521 Questions
Exam 10: Externalities543 Questions
Exam 11: Public Goods and Common Resources453 Questions
Exam 12: The Design of the Tax System563 Questions
Exam 13: The Costs of Production649 Questions
Exam 14: Firms in Competitive Markets608 Questions
Exam 15: Monopoly662 Questions
Exam 16: Monopolistic Competition649 Questions
Exam 17: Oligopoly522 Questions
Exam 18: The Markets for the Factors of Production592 Questions
Exam 19: Earnings and Discrimination511 Questions
Exam 20: Income Inequality and Poverty478 Questions
Exam 21: The Theory of Consumer Choice568 Questions
Exam 22: Frontiers in Microeconomics461 Questions
Select questions type
Scenario 21-3
Scott knows that he will ultimately face retirement. Assume that Scott will experience two periods in his life, one in which he works and earns income, and one in which he is retired and earns no income. Scott can earn $250,000 during his working period and nothing in his retirement period. He must both save and consume in his work period with an interest rate of 10 percent on savings.
-Refer to Scenario 21-3. Assume that Scott decides to consume $100,000 in the work period. How much money will he have available for consumption in his retirement period?
(Multiple Choice)
4.8/5  (42)
(42)
Figure 21-14 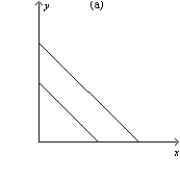
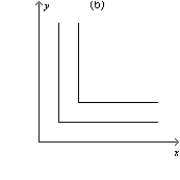
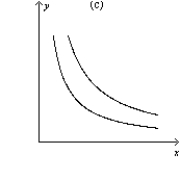 -Refer to Figure 21-14. Which of the following statements is correct?
(Multiple Choice)
4.9/5 (29)
Figure 21-4
In each case, the budget constraint moves from BC-1 to BC-2. 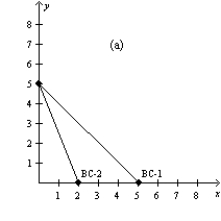
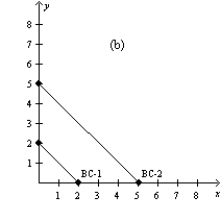
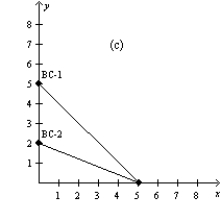
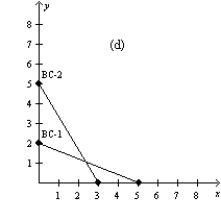 -Refer to Figure 21-4. Which of the graphs in the figure could reflect an increase in income?
(Multiple Choice)
4.9/5 (38)
Figure 21-25 The figure pertains to a particular consumer. On the axes, X represents the quantity of good X and Y represents the quantity of good Y. 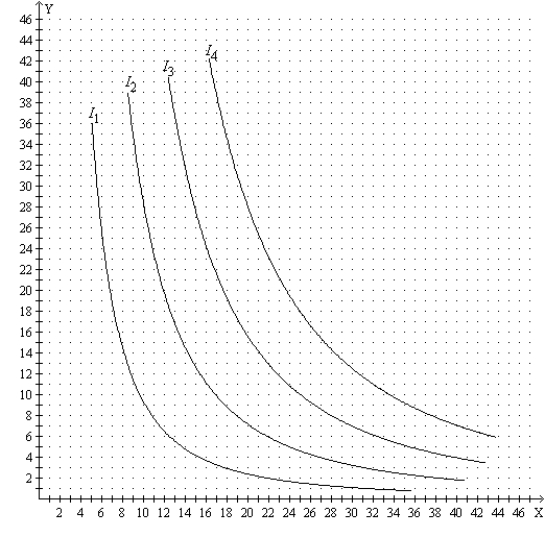 -Refer to Figure 21-25. Suppose the price of good X is $10, the price of good Y is $5, and the consumer's income is $210. Then the consumer's optimal choice is represented by a point on which curve?
(Multiple Choice)
4.8/5 (39)
Figure 21-14
-Refer to Figure 21-14. Which of the graphs illustrates indifference curves for which the marginal rate of substitution is constant?
(Multiple Choice)
4.9/5 (41)
Figure 21-8 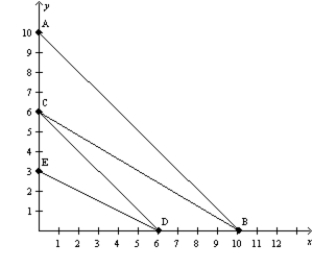 -Refer to Figure 21-8. You have $36 to spend on good X and good Y. If good X costs $6 and good Y costs $12, your budget constraint is
(Multiple Choice)
4.8/5 (27)
Figure 21-11 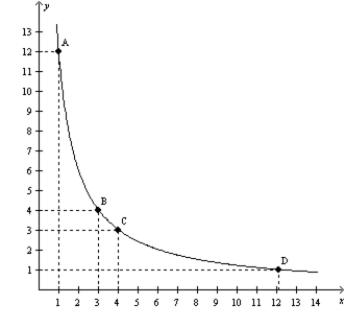 -Refer to Figure 21-11. As the consumer moves from point A to B to C to D, the consumer's total utility
(Multiple Choice)
4.9/5 (38)
Consider the indifference curve map and budget constraint for two goods, X and Y. Suppose the good on the horizontal axis, X, is normal. When the price of X increases, the substitution effect
(Multiple Choice)
4.8/5 (45)
Suppose a consumer spends her income on two goods: music CDs and DVDs. The price of a CD is $8, and the price of a DVD is $20. If we graph the budget constraint by measuring the quantity of CDs purchased on the vertical axis and the quantity of DVDs on the horizontal axis, what is the slope of the budget constraint?
(Multiple Choice)
4.7/5 (38)
Preston goes to the movies every Sunday afternoon. The movie theater offers 4 combinations of popcorn and beverages: the "mini-combo" costs $5 and includes a small popcorn and a small drink, the "medium-combo" costs $7 and includes a medium popcorn and a medium drink, the "value-combo" also costs $7 and includes a small popcorn and a large drink, and the "large-combo" costs $9 and includes a large popcorn and a large drink. Preston always purchases the "value-combo." We can conclude that
(Multiple Choice)
4.8/5 (37)
The following diagram shows one indifference curve representing the preferences for goods X and Y for one consumer. 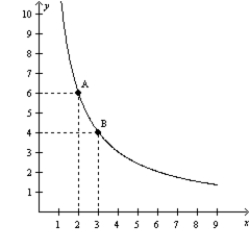 What is the marginal rate of substitution between points A and B?
(Multiple Choice)
4.9/5 (36)
Karen, Tara, and Chelsea each buy ice cream and paperback novels to enjoy on hot summer days. Ice cream costs $5 per gallon, and paperback novels cost $8 each. Karen has a budget of $80, Tara has a budget of $60, and Chelsea has a budget of $40 to spend on ice cream and paperback novels. Who can afford to purchase 8 gallons of ice cream and 5 paperback novels?
(Multiple Choice)
4.9/5 (41)
Which effect of a price change moves the consumer along the same indifference curve to a point with a new marginal rate of substitution?
(Multiple Choice)
4.8/5 (39)
Is it possible for a normal good to be a Giffen good? Briefly explain.
(Essay)
4.8/5 (24)
Which of the following examples would illustrate a backward-sloping labor supply-curve?
(Multiple Choice)
4.8/5 (41)
The slope of the budget constraint is all of the following except
(Multiple Choice)
4.9/5 (35)
Explain the relationship between the budget constraint and indifference curve at a consumer's optimum.
(Essay)
4.8/5 (34)
The indifference curves for left gloves and right gloves are straight lines.
(True/False)
4.9/5 (47)
Filters
- Essay(0)
- Multiple Choice(0)
- Short Answer(0)
- True False(0)
- Matching(0)