Exam 21: The Theory of Consumer Choice
Exam 1: Ten Principles of Economics455 Questions
Exam 2: Thinking Like an Economist645 Questions
Exam 3: Interdependence and the Gains From Trade550 Questions
Exam 4: The Market Forces of Supply and Demand693 Questions
Exam 5: Elasticity and Its Application625 Questions
Exam 6: Supply, Demand, and Government Policies671 Questions
Exam 7: Consumers, Producers, and the Efficiency of Markets547 Questions
Exam 8: Application: The Costs of Taxation507 Questions
Exam 9: Application: International Trade521 Questions
Exam 10: Externalities543 Questions
Exam 11: Public Goods and Common Resources453 Questions
Exam 12: The Design of the Tax System563 Questions
Exam 13: The Costs of Production649 Questions
Exam 14: Firms in Competitive Markets608 Questions
Exam 15: Monopoly662 Questions
Exam 16: Monopolistic Competition649 Questions
Exam 17: Oligopoly522 Questions
Exam 18: The Markets for the Factors of Production592 Questions
Exam 19: Earnings and Discrimination511 Questions
Exam 20: Income Inequality and Poverty478 Questions
Exam 21: The Theory of Consumer Choice568 Questions
Exam 22: Frontiers in Microeconomics461 Questions
Select questions type
Suppose the price of good X falls. As a result, the quantity demanded for good X increases for a particular consumer. For this consumer, the substitution effect induced the consumer to purchase more X while the income effect induced the consumer to purchase less X. We can infer that X is a(n)
(Multiple Choice)
4.8/5  (36)
(36)
Two economists found empirical evidence that when the price of rice decreased in the Hunan province of China, local residents consumed less rice than before the price decrease. The study provides a real-world example of a(n)
(Multiple Choice)
4.7/5 (30)
Figure 21-14 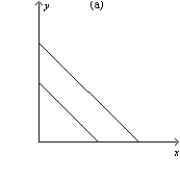
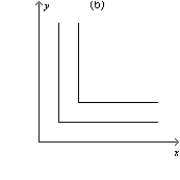
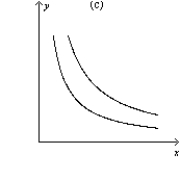 -Refer to Figure 21-14. Which of the graphs shown represent indifference curves for perfect substitutes?
(Multiple Choice)
4.8/5 (41)
The opportunity cost of current household consumption is the
(Multiple Choice)
5.0/5 (36)
Figure 21-14
-Refer to Figure 21-14. Which of the graphs shown may represent indifference curves?
(Multiple Choice)
4.9/5 (41)
Figure 21-14
-Refer to Figure 21-14. Which of the graphs illustrates indifference curves for which the marginal rate of substitution varies?
(Multiple Choice)
4.8/5 (40)
Figure 21-13 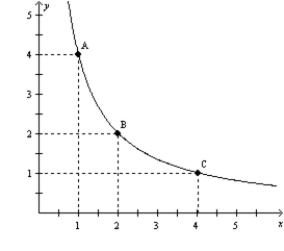 -Refer to Figure 21-13. As the consumer moves from A to B to C, the marginal rate of substitution
(Multiple Choice)
4.8/5 (50)
The two "goods" used when economists analyze labor supply are
(Multiple Choice)
4.9/5 (35)
Figure 21-5
(a)
(b) 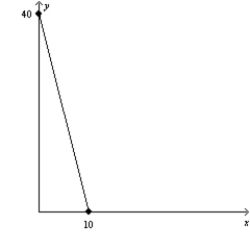
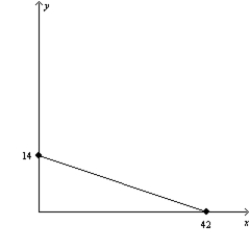 -Refer to Figure 21-5. In graph (b), what is the price of good X relative to the price of good Y (i.e., Px/Py)?
(Multiple Choice)
4.7/5 (30)
Figure 21-17 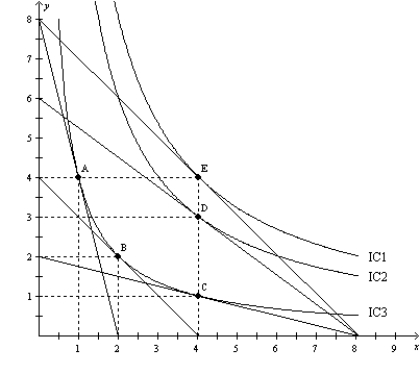 -Refer to Figure 21-17. When the price of X is $40, the price of Y is $40, and income is $160, Paul's optimal choice is point B. Then Paul's income increases to $320, and his optimal choice is point E. For Paul,
(Multiple Choice)
4.8/5 (31)
A consumer's preferences for right shoes and left shoes can be represented by indifference curves that are
(Multiple Choice)
4.7/5 (45)
Which of the following equations corresponds to an optimal choice point? (i)
MRS = PX/PY
(ii)
MUX/MUY = PX/PY
(iii)
MUX/PX = MUY/PY
(iv)
MUX/PY = MUY/PX
(Multiple Choice)
4.8/5 (38)
Figure 21-2 The downward-sloping line on the figure represents a consumer's budget
constraint. 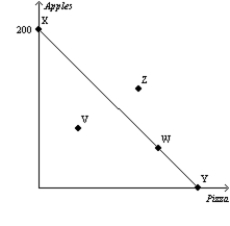 -Refer to Figure 21-2. A consumer who chooses to spend all of her income could be at which point(s) on the figure?
(Multiple Choice)
4.8/5 (40)
Karen, Tara, and Chelsea each buy ice cream and paperback novels to enjoy on hot summer days. Ice cream costs $5 per gallon, and paperback novels cost $8 each. Karen has a budget of $80, Tara has a budget of $60, and Chelsea has a budget of $40 to spend on ice cream and paperback novels. Who can afford to purchase 5 gallons of ice cream and 8 paperback novels?
(Multiple Choice)
4.7/5 (32)
Scenario 21-4 Frank spends all of his income of $240 per month on shirts and hats. The price of a shirt is $40 and the price of a hat is $30.
-Refer to Scenario 21-4. If Frank buys 3 shirts during a certain month, then how many hats does he buy during that month?
(Short Answer)
4.8/5 (31)
Figure 21-14
-Refer to Figure 21-14. Which of the graphs illustrates indifference curves for which the marginal rate of substitution is undefined?
(Multiple Choice)
4.9/5 (40)
Figure 21-25 The figure pertains to a particular consumer. On the axes, X represents the quantity of good X and Y represents the quantity of good Y. 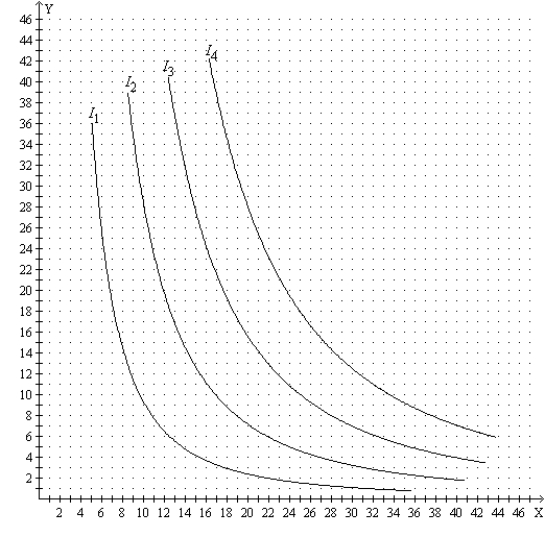 -Refer to Figure 21-25. Suppose the price of good X is $15, the price of good Y is $10, and the consumer's income is $450. Then the consumer's optimal choice is to buy
(Multiple Choice)
4.8/5 (40)
Filters
- Essay(0)
- Multiple Choice(0)
- Short Answer(0)
- True False(0)
- Matching(0)