Exam 23: Time-Series Analysis and Forecasting
Exam 1: What Is Statistics16 Questions
Exam 2: Types of Data, Data Collection and Sampling17 Questions
Exam 3: Graphical Descriptive Methods Nominal Data20 Questions
Exam 4: Graphical Descriptive Techniques Numerical Data64 Questions
Exam 5: Numerical Descriptive Measures150 Questions
Exam 6: Probability112 Questions
Exam 7: Random Variables and Discrete Probability Distributions55 Questions
Exam 8: Continuous Probability Distributions118 Questions
Exam 9: Statistical Inference: Introduction8 Questions
Exam 10: Sampling Distributions68 Questions
Exam 11: Estimation: Describing a Single Population132 Questions
Exam 12: Estimation: Comparing Two Populations23 Questions
Exam 13: Hypothesis Testing: Describing a Single Population130 Questions
Exam 14: Hypothesis Testing: Comparing Two Populations81 Questions
Exam 15: Inference About Population Variances47 Questions
Exam 16: Analysis of Variance125 Questions
Exam 17: Additional Tests for Nominal Data: Chi-Squared Tests116 Questions
Exam 18: Simple Linear Regression and Correlation219 Questions
Exam 19: Multiple Regression121 Questions
Exam 20: Model Building100 Questions
Exam 21: Nonparametric Techniques136 Questions
Exam 22: Statistical Inference: Conclusion106 Questions
Exam 23: Time-Series Analysis and Forecasting146 Questions
Exam 24: Index Numbers27 Questions
Exam 25: Decision Analysis51 Questions
Select questions type
The time-series component that reflects a wavelike pattern describing a long-term trend that is generally apparent over a number of years is called:
(Multiple Choice)
4.8/5  (39)
(39)
Which of the following represents the fluctuations up to a twelve month time period?
(Multiple Choice)
4.8/5 (33)
A company selling swimming goggles wants to analyze the company's Australian sales figure.
Describe the 4 components of the line graph of Swimming goggle quarterly sales (in $000's) given below. 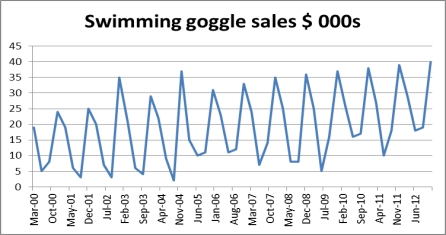
(Essay)
4.7/5 (35)
If autumn 2013 sales were $20 500 and the summer seasonal index was 1.17, then the deseasonalised 2010 autumn sales value would be:
(Multiple Choice)
4.9/5 (31)
The regression trend line for annual energy consumption for 1985-2005 is given by ŷt = 70 + 0.53t, where t = 1 for 1985. If the annual energy consumption for 2000 was 82.5, then the percentage of trend for 2000 was:
(Multiple Choice)
4.9/5 (33)
The trend line ?t = 14.13 - 0.54t was calculated from quarterly data for 2006-2010, where t = 1 for the first quarter of 2006. The trend value for the fourth quarter of the year 2011 is 1.170.
(True/False)
4.9/5 (38)
The smoothing component is one of the four components of a time series.
(True/False)
5.0/5 (35)
In an exponentially smoothed time series, the smoothing constant w is chosen on the basis of how much smoothing is required. In general:
(Multiple Choice)
4.8/5 (33)
We compute the five-period moving averages for all time periods except the first two and the last two.
(True/False)
4.9/5 (38)
If summer 2010 sales were $26 800 and the summer seasonal index was 1.15, the deseasonalised 2010 summer sales value is $30 820.
(True/False)
4.9/5 (37)
We calculate the three-period moving averages for a time series for all time periods except the:
(Multiple Choice)
4.8/5 (36)
Annual production (in millions) of computer chips in a large electronics company was recorded, as shown below. Year t Production 1990 1 26 1991 2 23 1992 3 21 1993 4 25 1994 5 32 1995 6 38 1996 7 43 1997 8 36 1998 9 29 1999 10 25 a. Calculate the percentage of trend for each time period.
b. Plot the percentage of trend.
c. Describe the cyclical effect (if there is one).
(Essay)
4.7/5 (38)
A time series is shown in the table below:
Day 1 2 3 4 Monday 16 15 18 21 Tuesday 22 21 20 25 Wednesday 20 23 20 24 Thursday 29 28 32 28 Friday 35 31 29 36 a. Compute the five-day moving averages to remove the seasonal and random variation.
b. Calculate the seasonal (daily) indexes.
c. What do the daily indexes tell us?
d. Find the regression trend line.
e. Calculate the seasonal indexes, based on the regression trend line developed in (d).
(Essay)
4.7/5 (26)
A company selling swimming goggles wants to analyze the company's Australian sales time figures.
Time series forecasting with regression was used to generate Excel output to estimate trend of the time series of Swimming goggle sales (in thousands of dollars) where the origin is the March Quarter 2000. SUMMARV OUTPUT Regression Stotitics Multiple R 0.37281 R Square 0.13899 Adjusted R Square 0.12243 StandardError 10.3925 Observations 54
Sgnificance df S MS F F Regression 1 906.5867925 906.59 8.39406 0.005497292 Residual 52 5616.172467 108 Total 53 6522.759259
Standard Upper Coefficients Error t Stat p-value Lower 95\% 95\% Intercept 12.237 2.789633876 4.3866 5.6-05 6.639227133 17.8348469 0.26289 0.090738795 2.8973 0.0055 0.080812368 0.4449738 Interpret the 95% confidence interval for time t.
(Essay)
4.9/5 (37)
In determining monthly seasonal indexes, the first step is to construct a centred moving average with a period of:
(Multiple Choice)
4.8/5 (34)
Which of the following methods may be used to smooth a time series sufficiently to remove the random variation and to discover the existence of the other time-series components?
(Multiple Choice)
4.9/5 (32)
Which method would you recommend in selecting the appropriate forecasting model if avoiding large errors is extremely important?
(Multiple Choice)
4.8/5 (30)
A time series regression equation for a surfboard manufacturing company in Australia is given below: Y = 35 + 4Q1 + 0.5Q3 + 8Q4 + 3t
With t in quarters, the origin is December 2010 and Q1 is the indicator variable for March, Q3 is the indicator variable for September and Q4 is the indicator variable for December.
Which of the following is the correct value of the estimate for the number of surfboards sold by this manufacturing company in March 2015?
(Multiple Choice)
4.8/5 (28)
To measure the seasonal variation, we compute seasonal indexes, which gauge the degree to which the seasons differ from one another.
(True/False)
4.8/5 (39)
A time series regression equation for a surfboard manufacturing company in Australia is given below: Y = 35 + 4Q1 + 0.5Q3 + 8Q4 + 3t
With t in quarters, the origin is December 2010 and Q1 is the indicator variable for March, Q3 is the indicator variable for September and Q4 is the indicator variable for December.
Which of the following is the correct value of the estimate for the number of surfboards sold by this manufacturing company in June 2013?
(Multiple Choice)
5.0/5 (34)
Filters
- Essay(0)
- Multiple Choice(0)
- Short Answer(0)
- True False(0)
- Matching(0)