Exam 9: Estimating a Population Proportion
Exam 1: Collecting Data in Reasonable Ways56 Questions
Exam 2: Graphical Methods for Describing Data Distributions62 Questions
Exam 3: Numerical Methods for Describing Data Distributions37 Questions
Exam 4: Describing Bivariate Numerical Data70 Questions
Exam 5: Probability55 Questions
Exam 6: Random Variables and Probability Distributions72 Questions
Exam 7: An Overview of Statistical Inference - Learning From Data19 Questions
Exam 8: Sampling Variability and Sampling Distributions35 Questions
Exam 9: Estimating a Population Proportion36 Questions
Exam 10: Asking and Answering Questions About a Population Proportion31 Questions
Exam 11: Asking and Answering Questions About the Difference Between Two Proportions42 Questions
Exam 12: Asking and Answering Questions About a Population Mean51 Questions
Exam 13: Asking and Answering Questions About the Difference Between Two Means46 Questions
Exam 14: Learning From Categorical Data36 Questions
Exam 15: Understanding Relationships - Numerical Data Part 243 Questions
Exam 16: Asking and Answering Questions About More Than Two Means25 Questions
Select questions type
The sampling distribution of p tends to be more spread out for larger sample sizes than for smaller sample sizes.
Free
(True/False)
4.9/5  (33)
(33)
Correct Answer: Verified
False
The large sample confidence interval formula for estimating p can always safely be used if  .
.
Free
(True/False)
4.7/5 (32)
Correct Answer:Verified
False
A statistic that is unbiased with a small standard error is likely to result in an estimate that is close to the actual value of the population characteristic.
Free
(True/False)
4.7/5 (44)
Correct Answer:Verified
True
Jasmine has decided to decrease the confidence level in her estimation of a population proportion. What is the effect on the width of the associated confidence interval?
(Multiple Choice)
4.8/5 (42)
A dietitian wants to know the average number of vegetarians in his State. He would like to obtain the data with the margin of error no more than 0.01 for the confidence level of 95%. According to his previous studies, he knows that the population proportion of vegetarians is approximately 3.2%. Four hundred people took part in the previously studied. Should the dietitian invite the same number of people for the new study to obtain the margin of error no more than 0.01?
(Multiple Choice)
4.9/5 (28)
To estimate the proportion of faculty at a state university who own a home, a random sample of faculty is selected. For which of the following combinations of n and  would it be appropriate to use the confidence interval
 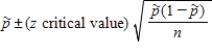 to estimate the population proportion?
(Multiple Choice)
4.9/5 (35)
A researcher would like to determine the proportion of college students who support capping textbook prices. The researcher gathers a random sample of 500 students and asks whether or not they support textbook price caps. Of the 500 students, 378 say they support capping textbook prices. Determine if the large sample confidence interval procedure can be used for estimation and create a 95% confidence interval for the population proportion.
(Essay)
4.8/5 (27)
Conventional home smoke alarms have too often failed to awaken sleeping children--they are remarkably resistant to being awakened by sound, even in the daytime! Researchers are studying the possibility that a personalized "voice" smoke alarm would be more effective than mere sound. The idea is that a recording of the mother's voice calling the child's name may be an improvement over existing systems.
a)The researchers would like to estimate p to within 0.05 with 95% confidence. Past experience has shown that conventional alarms are effective about 0.58 of the time. If this is accepted as a reasonable initial estimate of p, what sample size should they use for their study?
b)Suppose the researchers felt that the original study, done with children of parents working in a single hospital, was different enough so that their results (p = 0.58) should not be relied upon. In a few sentences, explain how your procedure for choosing a samples size would differ from your solution in part (a). (Do NOT recalculate a new estimate of the necessary sample size!)
(Essay)
4.8/5 (31)
Three different statistics are being considered for estimating a population characteristic. The sampling distributions of the three statistics are shown in the following illustration: 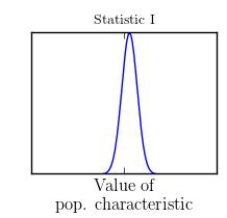
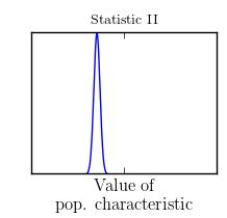
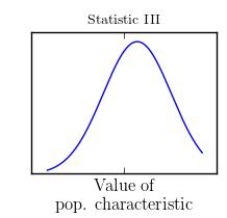 Which statistic would you recommend?
(Multiple Choice)
4.9/5 (31)
When choosing a statistic for computing an estimate, what factors should be considered?
(Essay)
4.8/5 (35)
What is the difference between an unbiased statistic and a biased statistic?
(Essay)
4.8/5 (27)
All else being equal, the higher the confidence level, the wider the confidence interval.
(True/False)
4.8/5 (35)
A manager of a dealer center wants to know what is the percentage of consumers who prefer sedan cars. He collects some information about selling cars in his city from several dealer centers. It appears that 47 consumers out of 142 prefer sedan cars. Estimate the proportion of consumers who prefer a sedan and calculate the margin of error with the confidence level of 95%.
(Multiple Choice)
4.9/5 (31)
The city administration wants to find out how many college students visit the city library regularly. The survey has been conducted among the students of this city. There were 356 students who responded to the survey question, and 102 of them responded that they visited the city library regular. Estimate the proportion of the college students in the city who visit the library regularly and calculate the margin of error with the confidence level of 95%.
(Multiple Choice)
4.8/5 (37)
The management of the company decided to find out what percent of employees are late for work. According to the results of observations performed during the month, it was found that on average each day about 7.5% of employees are late for work. The standard error of the study was 0.011. Find and interpret the margin of error for this study with the confidence level of 95%.
(Multiple Choice)
4.9/5 (26)
If the distribution of a population is symmetric, both the mean and median give unbiased estimates of the population mean. What criteria would you consider in choosing which statistic to use if you wanted to estimate the population mean?
(Essay)
5.0/5 (31)
Chuck has decided to increase the size of the sample he uses to estimate a population proportion.
What is the effect on the width of the associated confidence interval?
(Multiple Choice)
4.8/5 (29)
Eyestrain is thought to be associated with different types of office work. The Acme Temp-Help Company provides short-term employees to substitute for vacationing data entry personnel. Previous research has shown that approximately 21% of full time data entry personnel have eyestrain, and Acme would like to estimate the proportion, p, of their 6,000 part-time data entry employees that have eyestrain.
a)They would like to estimate p to within 0.05 with 95% confidence. If they accept the starting value of 0.21 as a reasonable initial estimate of p, what sample size should they use for their study?
b)Suppose Acme had felt that the working conditions of their temporary data entry personnel were different enough that they should not depend on the 0.21 as an initial estimate. In a few sentences, explain how your procedure for choosing a samples size would differ from your solution in part (a). (Do NOT recalculate a new estimate of the necessary sample size!)
(Essay)
4.8/5 (33)
Suppose that a newspaper conducts a survey of a random sample of 120 registered voters in order to predict the winner of a local election. The Republican candidate was favored by 62 of the respondents.
a)Construct and interpret a 99% CI for the true proportion of voters who prefer the Republican candidate.
b)If a candidate needs a simple majority of the votes to win the election, can the Republican candidate be confident of victory? Justify your response with an appropriate statistical argument.
(Essay)
4.9/5 (30)
According to the article "The incidence of congenital heart disease." (Hoffman, J.I.E., Kaplan, S., J.Am.Coll.Cardiol. [2002]:1890-1900)about 1% of newborns in U.S. have congenital heart disease. A researcher wants to repeat this study to verify the results. He finds that 9 out of 984 newborns studied have congenital heart disease. Use the accompanying output from the "Bootstrap Confidence Interval for One Proportion" Shiny app to report a 95% bootstrap confidence interval for the proportion of the U.S. newborns who have congenital heart disease. Interpret the obtained result.
(Multiple Choice)
4.7/5 (30)
Filters
- Essay(0)
- Multiple Choice(0)
- Short Answer(0)
- True False(0)
- Matching(0)