Exam 5: Probability
Suppose you want to estimate the probability that a randomly selected customer at a particular grocery store will pay by credit card. Over the past 3 months, 70,600 purchases were made, and 22,200 of them were paid for by credit card. What is the estimated probability that a randomly selected customer will pay by credit card?
A
One method for increasing sales of boxes of cereal is to suggest to children that they complete a "set" of small toys. Suppose one of a set of five toys is put in every box. Using one strategy the company could put a randomly selected toy in each box of cereal. Then each toy would appear in 20% of the boxes. You are to design a simulation that will assess this strategy and the likely number of boxes of cereal needed to complete the set of toys.
a)To simulate this strategy, assign digits to the toys that will result in the probability of selection of each toy to be 0.20.
Toy 1 Digits:
Toy 2 Digits:
Toy 3 Digits:
Toy 4 Digits:
Toy 5 Digits:
b)Describe how you would use a random digit table to conduct one run of your simulation, where one run continues until a complete set of the 5 toys is acquired.
d)Suppose that the cereal company decides to put the toys in the boxes with different probabilities. Toy 1 will be put in 30% of the boxes, Toys 2 and 3 will be put in 20% of the boxes, and Toys 4 and 5 will be put in 15% of the boxes. Assign digits to the toys that will simulate these probabilities.
Toy 1 Digits:
Toy 2 Digits:
Toy 3 Digits:
Toy 4 Digits:
Toy 5 Digits:
Note: For simulation questions, there are many different correct ways to assign digits. In the answer key, an answer will be given, but it is just one of many possible correct answers.
a)Toy 1 digits: 0-1
Toy 2 digits: 2-3
Toy 3 digits: 4-5
Toy 4 digits: 6-7
Toy 5 digits: 8-9
b)Starting in the upper left corner of a random digit table, I would look at single digits from 0-9 until I get at least 1 digit from 0-1, 1 digit from 2-3, 1 digit from 4-5, 1 digit from 6-7, and 1 digit from 8-9. Then, I would count the number of digits I needed to look at to achieve this.
c)6 (toy 4)1 (toy 1)7 (extra toy 4)9 (toy 5)0 (extra toy 1)5 (toy 3)5 (extra toy 3)3 (toy 2)Thus, it took 8 cereal boxes to get the set of 5 toys.
d)Toy 1 digits: 00-29
Toy 2 digits: 30-49
Toy 3 digits: 50-69
Toy 4 digits: 70-84
Toy 5 digits: 85-99
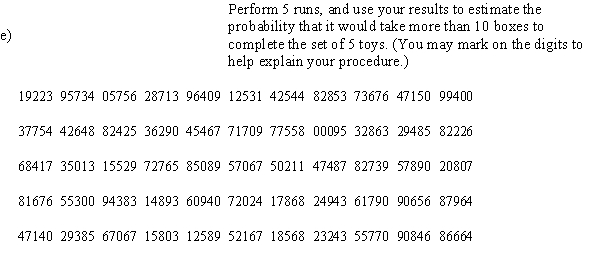
e)Using the scheme from part d), the first 5 trials gave the following results:
9, 12, 7, 6, 9
Thus, the probability that it takes more than 10 boxes is  .
.
The event "A or B " consists of all of the outcomes in both of the events.
False
Suppose there are two detectives in a small private office that is engaged in the search for people and the probability that a person will be found for each of the two detectives is equal to 0.754 for Detective 1 and 0.831 for Detective 2. Further, suppose that Detective 1 works part-time and considers 40% of cases of missing people and that Detective 2 considers the remaining 60%. Use the given probability information to select a "hypothetical 1000" table.
Two events are said to be disjoint or mutually exclusive when they have no outcomes in common.
In a particular city, 45% of donors have type O blood. On a certain day, the blood bank needed 4 donors with type O blood to restock their reserves. The director has the option of waiting to get 4 donors during the day, or ordering type O blood from a neighboring blood bank. The director would like to replace the blood before 12 donors come to the bank, the typical number to arrive before noon. Your task is to design and conduct a simulation to estimate the probability it takes 12 or more donors to get 4 with type O blood.
a)To simulate the arrival of blood donors from this population, assign digits to the blood types that will result in a probability of success (Type O donor) of 0.45.
Type O Digits:
Other than Type O Digits:
b)Describe how you would use a random digit table to conduct one run of your simulation.
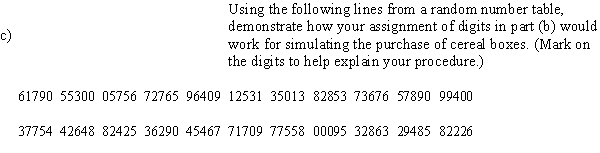
c)Using the following lines from a random digit table, perform 5 runs. Based on your results, what do you estimate to be the probability of getting 4 Type O donors before 12 donors arrive at the blood bank? (Mark on the digits to help explain your procedure.)
In November 2002, Janet Napolitano, a Democrat, was elected Governor of Arizona, defeating Republican Matt Salmon and Independent Richard Mahoney. This was a somewhat surprising outcome, since there are more registered Republicans than Democrats in the state. The table below presents the results of a sample of voters in the election. The number who voted for each of the candidates is presented in the rows, and the party affiliation of the voters is presented in the columns. Suppose that a voter is randomly chosen from these respondents. Use the information in the table to answer the questions below. In showing your work, define and use appropriate notation. 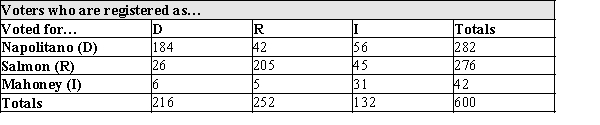
a)What is the probability that a randomly chosen voter voted for Napolitano?
b)What is the probability that a randomly chosen voter is a registered Democrat?
c)What is the probability that a randomly chosen voter cast a vote for Napolitano, given that the selected voter is a Democrat?
d)Commenting on this election. A local reporter said, "Napolitano won because she attracted a larger share of crossover voters." (A crossover voter is defined as one who votes differently than his or her party affiliation). What is the probability that a randomly chosen voter cast a vote for Napolitano, given that he or she is a crossover voter?
Investigators recently reported the results a study designed to assess whether or not the herb, St. John's Wort is effective in treating moderately severe cases of depression. The study involved 338 subjects, randomly assigned to receive one of three treatments: St. John's Wort , Zoloft, or a placebo. The authors were primarily interested in whether St. John's Wort performed better than placebo and included Zoloft as a "way to measure how sensitive the trial was to detecting antidepressant effects." Their results are presented in the table below. 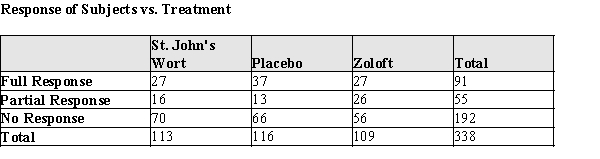
a)What is the probability that a randomly selected subject had no response?
b)What is the probability that a randomly selected subject was treated with Zoloft and had a full response?
c)What is the probability that a randomly selected subject had a full or partial response given that they were treated with St. John's Wort?
d)What is the probability that a randomly selected subject that didn't have a full response was treated with Placebo?
Each time a class meets, the professor selects one student at random to explain the solution to a homework problem. There are 60 students in the class, and no one ever misses class. Luke is one of these students. What is the probability that Luke is selected both of the next two times that the class meets?
Any collection of possible outcomes of a chance experiment is called a sample space.
The classical view of probability is based on the Law of Large Numbers.
A statistics class conducts a chance experiment in which they observe students who buy a snack and the school vending machines. The type of food (Liquid, or Solid) is noted, as well as the number of calories of fat content (25, 50, or 75).
Let L be the event that the item is liquid and B be the event that the item has fewer than 75 calories of fat.
a)What outcomes are in BC?
b)What outcomes are in  ?
c)What outcomes are in
?
c)What outcomes are in  ?
?
Three of the most common pets that people have are cats, dogs, and fish. In fact, many families have more than one type of pet, and some have all three! Suppose that a family is selected at random. Define the following events, with the probabilities given. (Note: the fish-and-cats combination doesn't seem too popular!) 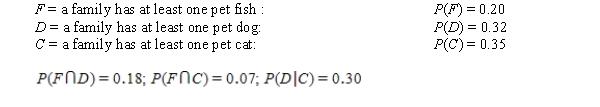
Calculate each of the following (show your work):
i)
Calculate each of the following (show your work):
i)  ii)
ii)  iii)
iii) 
A small ferryboat transports vehicles from one island to another, and the order the vehicles arrive will lead to slightly different placement on the ferry. Consider the chance experiment where the type of vehicle--passenger (P) or recreational (R) vehicle--is recorded for each of the next two vehicles that arrive at the dock.
a)List all the events in the sample space.
b)Using your sample space in part (a), list the outcomes for each of the following events:
A = the event that both vehicles are passenger cars
B = the event that both vehicles are of the same type
C = the event that there is at least one passenger car
A:
B:
C:
In a special report, "Speed Demons," in the Cedar Rapids, IA, Gazette, reporters used a radar gun to check the speeds of motorists in two counties. They were shocked (!) to discover that some motorists were driving at a speed greater than the posted limits. They reported the following information: 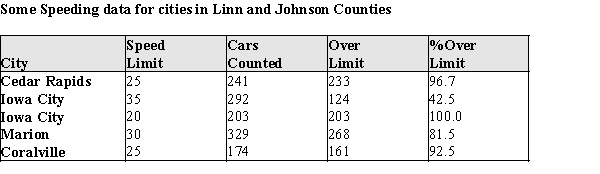 Suppose that one of these cars is selected at random. Consider the following events:
F = the event that a driver is in a "fast lane" (speed limit above 25 mph).
S = the event that a driver is speeding.
Suppose that one of these cars is selected at random. Consider the following events:
F = the event that a driver is in a "fast lane" (speed limit above 25 mph).
S = the event that a driver is speeding.
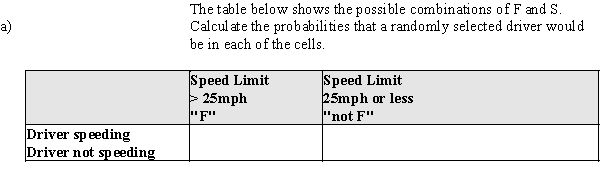
b)From the information in part (a), calculate
b)From the information in part (a), calculate  .
c)From the information in part (a), calculate
.
c)From the information in part (a), calculate  .
d)From the information in part (a), calculate P(S).
e)These events are represented in a tree diagram below. What is the probability that a randomly selected driver will "follow the branches" to the X?
.
d)From the information in part (a), calculate P(S).
e)These events are represented in a tree diagram below. What is the probability that a randomly selected driver will "follow the branches" to the X? 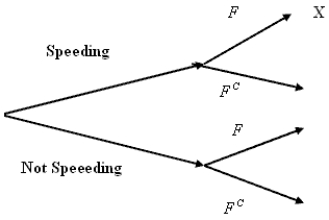
Exhibit 5-1
In a survey of airline travelers, subjects were observed in the coach section of airplanes to determine if men or women are bothered by a seatmate of the opposite gender using the common armrest. ("Passengers who were asleep or lovers cuddled together were not counted, since these were considered confounding circumstances.")The table below contains data gathered in that study. 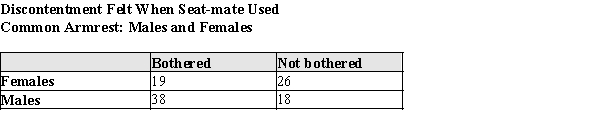 Suppose one of these passengers was randomly selected. Use the information in the table to answer the questions below. In showing your work, define and use appropriate notation.
-Refer to Exhibit 5-1.
a)What is the probability that the passenger is female?
b)What is the probability that the passenger is female or bothered?
c)What is the probability that the passenger is male and not bothered?
Suppose one of these passengers was randomly selected. Use the information in the table to answer the questions below. In showing your work, define and use appropriate notation.
-Refer to Exhibit 5-1.
a)What is the probability that the passenger is female?
b)What is the probability that the passenger is female or bothered?
c)What is the probability that the passenger is male and not bothered?
The basketball team at North Snowshoe High is in a little bit of trouble. Two of their players have just fouled out on technicals, and due to the flu the coach only has 4 players to choose from: three forwards and a guard who doubles as the team statistician. In his haste, the coach will randomly choose two of the four to go into the game, and of course will do so without replacement. What is the probability that the team statistician will be selected?
Suppose a survey was conducted among women ages 20 to 40. Consider the following events: 
And
And

Data from the survey were used to estimate the following probabilities:
Data from the survey were used to estimate the following probabilities:


Use the given probability information to select a "hypothetical 1000" table.
Use the given probability information to select a "hypothetical 1000" table.
Suppose you want to estimate the probability that a patient will develop an infection while hospitalized at a particular hospital. In the past year, this hospital had 8,650 patients, and 812 of them developed an infection. What is the estimated probability that a patient at this hospital will develop an infection?
Filters
- Essay(0)
- Multiple Choice(0)
- Short Answer(0)
- True False(0)
- Matching(0)