Exam 12: Asking and Answering Questions About a Population Mean
The composition of the earth's atmosphere may have changed over time. One attempt to discover the nature of the atmosphere long ago involved measuring the gas trapped in bubbles inside ancient amber. Amber is tree resin that has hardened and been trapped in rocks. Measurements on nine amber specimens from the late Cretaceous era (95 to 65 million years ago) give the following percentages of nitrogen:
63.4, 65.0, 64.4, 63.3, 54.8, 68.5, 60.8, 59.1, 51.0
Assume that it is reasonable to regard these trapped gas bubbles as a random sample of bubbles from the Cretaceous atmosphere.
a)Construct and interpret a 95% confidence interval for the mean percentage of nitrogen in the Cretaceous atmosphere.
b)The mean percentage of nitrogen in the atmosphere today is about 79%. Based on the confidence interval from part (a), do you think that the percentage of the atmosphere that is nitrogen has changed from the late Cretaceous era? Explain.
a)The distribution is close enough to a normal distribution to allow the use of the t confidence interval. (Normal probability plot shown below.) With  ; sx = 5.44, this makes the 95% confidence interval
 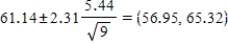 . I am 95% confident that the level of nitrogen in the Cretaceous atmosphere is between 56.95% and 65.32%.
 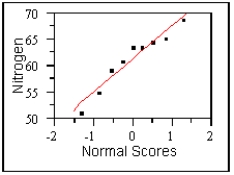 b)The mean percentage of nitrogen apparently has changed, since the modern value, 79%, is not in the confidence interval.
Let  represent the mean value of the
  sampling distribution and
  represent the population mean. What can be done to reduce the difference between
  and
and  ?
?
E
An important part of any dispensing process is statistical quality control. At the Billy Goat Gruff Inn, machines are set to dispense 600 ml of soda into every customer's glass. Over time, however, the machine can get "out of control" and dispense too much soda or too little. At a random point in time each clock hour, the owner dispenses and checks a glass of dispensed soda and determines the actual volume of soda dispensed. One day the volumes of the dispensed soda were:
600.15, 599.92, 599.85, 599.92, 599.81, 600.14, 600.04, 599.98
Is there sufficient evidence to conclude that the dispensing machine needs some adjustment?
1)μ = true mean volume of soda dispensed (ml)2)H0 : μ = 600
3)Ha : μ ≠ 600
4)α = .05
5)  6)Random sample? Given in the problem.
Normal population? Based on the sample, this seems reasonable.  7)
7) 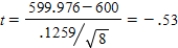 df = 7
8)P-value = P(t < −.53) = .6102
9)Since the P-value > α, we fail to reject H0. We cannot conclude that the true mean volume of soda dispensed is different than 600 ml. That is, the sample does not give sufficient evidence that the machine needs adjustment.
The principal at John F. Kennedy High School has been asked to provide the average number of classes taken by the students at KHS. Since the computer system is down, she takes her alphabetized list of students, randomly selects 50 students, determines the number of classes each of the 50 selected students is taking, and calculates  . She then reports to the PTA "Since I took a large random sample, the population mean number of classes taken by the students at KHS is 5.4." Write a short paragraph to send to her that explains why her statement is not correct.
In your own words, distinguish between "statistical" and "practical" significance.
When performing tests of hypotheses, there are assumptions that must be met in order for the test to be appropriate. For the test of a hypothesis about a population mean, and given the raw data, describe how you would check the assumptions.
At Abraham Lincoln High School a popular achievement test is used for college placement. Counselors selected a random sample of 100 students from Abraham Lincoln High School and scored their tests by hand before sending them in for computer processing. For this sample,  and s = 25. Construct a 99% confidence interval for μ, the population mean score for Abraham Lincoln High.
The standard deviation of the distribution of  decreases as n increases.
Reading comprehension is arguably the single most important skill a student possesses. To assess the current levels of reading comprehension in 3rd grade, 25 students were randomly selected from school district class lists and given a reading comprehension test. The distribution of their scores was approximately normal with a mean of 180 and a standard deviation of 20.12. Construct a 99% confidence interval for μ, the population mean.
A new species of sea crab has been discovered, and an experiment conducted to determine whether or not the animal can regulate its temperature. That the animal can maintain a body temperature different from the surroundings would be considered evidence of this regulating capability. Ten of these sea crabs were exposed to ambient temperatures of 24 degrees Celsius. Their body temperatures were measured with the results below:
24.33, 24.61, 24.67, 24.64, 24.42, 24.97, 25.23, 24.73, 24.90, 24.44
For purposes of this example, assume that it is reasonable to regard these 10 crabs as a random sample from the population of all crabs of this species.
a)Calculate an estimate of the population mean.
b)Construct and interpret a 99% confidence interval for μ.
c)Does it appear from these data that the crabs are able to regulate their body temperature? Provide statistical justification for your response.
The confidence interval formula for estimating μ when n is large is based on the Central Limit Theorem.
In an analysis of hunting by African lions, biologists filmed prey captures from the safety of their vehicles. The capture of prey was divided into a sequence of events for study one of which is the stalk, defined as the reduction of predator-prey distance for prey that has been specifically located and the prey is unaware of or minimally alarmed by the predator. The investigators identified two types of stalk: (a) "crouching"--the lion is concealed and either the lion advances toward the prey or the prey advances (unaware) toward the lion, and (b) "running"--the lion is less concealed and advances toward the prey in a rapid manner.
Data on lions' stalks of wildebeests and zebras from a simple random sample of 159 kills appear in the table below. 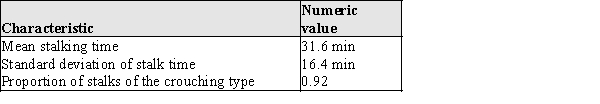
a)By monitoring radio-collared lions for many years, biologists believe that the average stalking time among all prey is approximately 25.6 minutes. Do the data above provide evidence that for this population of lions the average time to stalk wildebeests and zebras is different from what was originally thought?
b)The same monitoring of radio-collared lions over the years suggests that the overall proportion of stalks that are the crouching type is about 0.87. Do the data above provide evidence that for this population of lions the proportion of crouching stalks of wildebeests and zebras is greater than what was originally thought?
For n sufficiently large, the distribution of  is approximately a standard normal distribution.
Consider sampling from a skewed population. As the sample size, n, increases, some characteristics of the sampling distribution of  change. Does an increasing sample size cause changes in the characteristics of the sampling distribution shown below? If so, specifically how does the sampling distribution change?
a)The mean of the sampling distribution of
change. Does an increasing sample size cause changes in the characteristics of the sampling distribution shown below? If so, specifically how does the sampling distribution change?
a)The mean of the sampling distribution of  b)The standard deviation of the sampling distribution of
  c)The shape of the sampling distribution of
One indicator of the health of field mice is the length of their tails. The following data were gathered on a random sample of field mice. A University biologist would like to construct a 95% confidence interval for the population mean tail length of the field mice near Fairfield. (Measures are in mm). 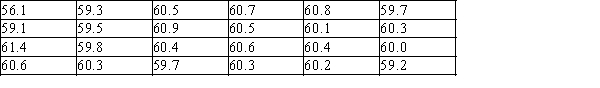 a)Using a graphical display of your choice, display the data in a way that will allow you to determine whether it would be appropriate to use a 95% t confidence interval to estimate the population mean.
b)Using the graphical display from part (a), would you advise that constructing a 95% confidence interval is appropriate? Provide statistical justification for your answer.
a)Using a graphical display of your choice, display the data in a way that will allow you to determine whether it would be appropriate to use a 95% t confidence interval to estimate the population mean.
b)Using the graphical display from part (a), would you advise that constructing a 95% confidence interval is appropriate? Provide statistical justification for your answer.
A t curve is bell-shaped like the z curve but is less spread out.
In cities and towns on the borders between states there is a significant amount of flight across state lines to avoid high state taxes on gasoline. Some states (such as Iowa) have large rivers for borders and tolls to cross the bridges. Do these tolls impede traffic to other states to get cheaper gasoline? To test this hypothesis, an experimental Toll-Free Week will be instituted at the Farmington Bridge, where currently 50 cars per day drive out of the state. Let μ denote the true average number of border crossings per day at Farmington if there were no toll.
a)What is the appropriate null hypothesis?
b)What is the appropriate alternative hypothesis?
c)In your own words, distinguish between a Type I and a Type II error in this context.
Researchers studied how many emails a day receive the office workers of the large company. They determined that the mean number of incoming emails per day for a representative sample of 7 office workers was 108 emails. The original sample data values are:  Select the most appropriate 99% bootstrap confidence interval for a population mean number of incoming emails per day for office workers of the large company and its correct interpretation.
Filters
- Essay(0)
- Multiple Choice(0)
- Short Answer(0)
- True False(0)
- Matching(0)