Exam 15: Understanding Relationships - Numerical Data Part 2
A study investigating the relationship between the major league batting average of non-pitching rookies (y) and their career minor league batting average (x) yields the following data: 
a)Write the estimated regression line below.
b)On the graph below, sketch the sample regression line using the information above. Be sure to label and scale your axes correctly.
a)Write the estimated regression line below.
b)On the graph below, sketch the sample regression line using the information above. Be sure to label and scale your axes correctly.  c)What is your estimate of the average change in major-league batting average associated with an increase of 0.050 in the career minor-league batting average?
d)What major-league batting average would you predict for a randomly selected individual with a career minor-league batting average of 0.300?
e)The value of se is 0.015. Interpret se in the context of this problem.
c)What is your estimate of the average change in major-league batting average associated with an increase of 0.050 in the career minor-league batting average?
d)What major-league batting average would you predict for a randomly selected individual with a career minor-league batting average of 0.300?
e)The value of se is 0.015. Interpret se in the context of this problem.
a) 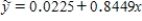 b)graph:
 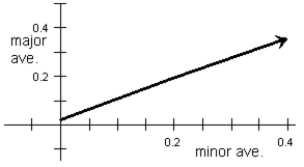 c)0.050b = 0.0422
d)0.0225 + 0.8449(0.300) = 0.276
e)se is the typical variation about the regression line. Players with equal minor league averages would typically vary about 0.015 in their major league average.
The point estimate a + bx* is an unbiased statistic that can be used to estimate the mean value of y when x = x*.
True
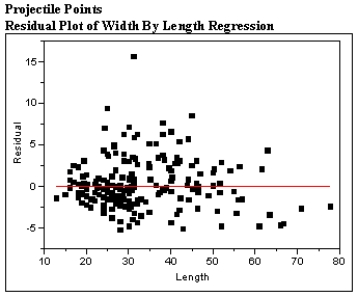
The scatter plot and residual plot shown below is from a regression analysis of Prehistoric Native American projectile points. The widths of the projectiles were regressed on the length of the projectile points. 
 Using these plots categorize each of the Basic Assumptions of the simple linear regression model as one of the following:
a)Not checkable
b)Checked and met
c)Checked and not met
For all assumptions checked, explain what aspect of the graphs led you to your conclusion that the assumption was met or not met.
Using these plots categorize each of the Basic Assumptions of the simple linear regression model as one of the following:
a)Not checkable
b)Checked and met
c)Checked and not met
For all assumptions checked, explain what aspect of the graphs led you to your conclusion that the assumption was met or not met.
Checking the assumptions:
•The distribution of deviations, e, at any particular x value has mean value 0.
Checked and met. There are only a couple of points, at either end, for which this is in doubt.
•The standard deviation of e is the same for any particular x value.
Checked and not met. There seems to be more variation for values in the middle of the range, and less on either end.
•The distribution of e at any particular x value is normal.
Checked and not met. This appears to be skewed toward the higher values, with the tails of the residuals extending to +15 on the positive side, but only about −5 on the negative side.
•The deviations associated with different observations are independent of one another.
Not checkable. There is no information provided about how this sample was obtained. If some of the points were found together, perhaps made by the same individual with a unique style, the deviations might not be independent.
In the simple linear regression mode, σe depends on the value of x.
In the simple linear regression model, α and β are fixed numbers that are usually unknown.
In a study of the surface temperatures of vital (living) and non-vital (dead) teeth in a random sample of 32 adults seeking dental care at a university clinic, temperatures of vital and non-vital teeth were measured for each individual. From their examination of the data the investigators felt that the assumptions of the linear regression model were satisfied. The computer output shown below was generated. 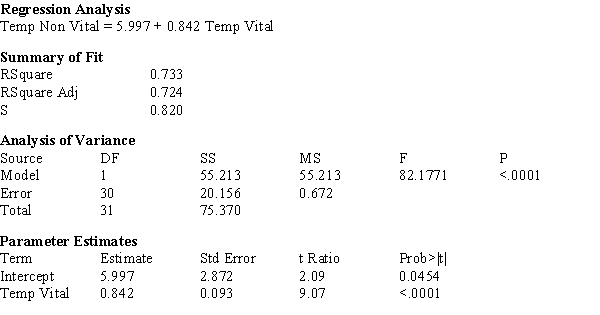
a)What proportion of observed variation in the surface temperature of non-vital teeth can be explained by the surface temperature of vital teeth?
b)Does the simple linear regression model appear to be useful? Justify your response with specific references to the computer output.
a)What proportion of observed variation in the surface temperature of non-vital teeth can be explained by the surface temperature of vital teeth?
b)Does the simple linear regression model appear to be useful? Justify your response with specific references to the computer output.
The Iowa Tests of Educational Development are given each year to students around the country. Let x = the previous year's science scores and y = the current year's science scores for a sample of current sophomores who took the test both years.
b = estimated slope of the regression line = 0.93
a = estimated y intercept of the regression line = 30.36
a)What is the equation of the estimated regression line?
b)On the graph below, sketch the estimated regression line using the information above. Be sure to label and scale your axes correctly.  c)For students with a score of 250 the previous year, what is the predicted score for the current year?
d)What is the average difference in science score that is associated with a 10-point difference in the previous year's science score?
e)The value of r2 is 0.71; interpret r2 in the context of this problem.
f)The value of se is 25.5. Interpret se in the context of this problem.
c)For students with a score of 250 the previous year, what is the predicted score for the current year?
d)What is the average difference in science score that is associated with a 10-point difference in the previous year's science score?
e)The value of r2 is 0.71; interpret r2 in the context of this problem.
f)The value of se is 25.5. Interpret se in the context of this problem.
In the simple linear regression, the standard deviation of y is the same as the standard deviation of the random deviation
e.
Let x be the number of pages in a statistics text book and y be the cost of the book (in dollars.) Suppose that x and y are related according to the simple linear regression model with
β
= slope of the population regression line = 0.075
α
= y intercept of population regression line = 25.0
a)What is the equation of the population regression line?
b)On the graph below, sketch the population regression line using the information above. Be sure to label and scale your axes correctly.  c)For a statistics book of 900 pages, what is the predicted cost in dollars?
d)What is the average change in price that is associated with a one-page increase in size of a statistics book?
e)What is the average change in price that is associated with a 20-page increase in size of a statistics book?
c)For a statistics book of 900 pages, what is the predicted cost in dollars?
d)What is the average change in price that is associated with a one-page increase in size of a statistics book?
e)What is the average change in price that is associated with a 20-page increase in size of a statistics book?
In a study of gender typing of toys, fathers and mothers were asked to rate the gender appropriateness of toys on a scale of 1 (Definitely for girls) to 5 (Definitely for boys). The investigators did a regression analysis of the fathers' mean ratings vs. the mothers mean ratings for each toy. A computer-generated normal probability plot of the residuals is shown below.
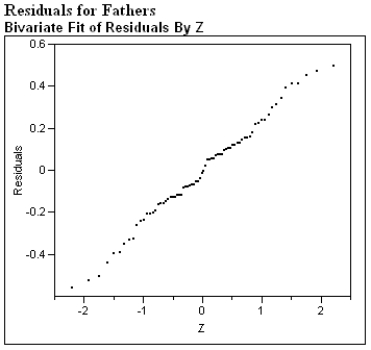
Write a brief paragraph describing the plot. Based on your description recommend to the investigators whether or not the appropriate assumption is met for simple linear regression.
Write a brief paragraph describing the plot. Based on your description recommend to the investigators whether or not the appropriate assumption is met for simple linear regression.
A standardized residual plot with spread increasing from left to right suggests that the variance of y is not the same at each x value.
In the simple linear regression model, the point estimate and the point prediction are identical for a particular value of x.
As part of a study of the swimming speed of sharks, a random sample of 18 lemon sharks (Triakis semifasciata) were observed in a laboratory sea tunnel. Body lengths and maximum sustainable swimming speeds ("MSSS," reported in body lengths per second) were measured for each shark. The computer output from a regression with y = MSSS and x = body length is given below.
Linear Fit MSSS=1.8928955-0.0104278 * Length
Summary of Fit
RSquare 0.526395
RSquare Adj 0.496794
S 0)272031
Mean of Response 1.24
N Observations 18
Analysis of Variance
Source DF Sum of Squares Mean Square F Ratio
Model 1 1.3159870 1.31599 17.7834
Error 16 1.1840130 0.07400 Prob > F
Total 17 2.5000000 0.0007*
Parameter Estimates
Term Estimate Std Error t Ratio Prob > |t|
Intercept 1.8928955 0.167575 11.30 < 0.0001*
Length(cm) -0.010428 0.002473 -4.22 0.0007*
According to the above computer output, if body length increases by one unit, by how much will the swimming speed, in body lengths per second, change?
The computer output given below shows a regression of Wing Length (mm) vs. Body Mass (g) for sphinx moths. 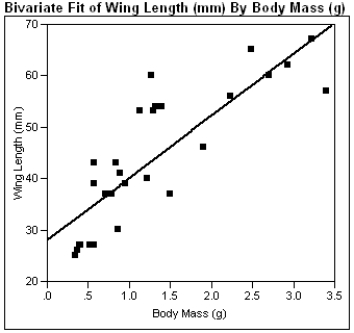
a)What is the estimated regression line?
b)What is the calculated value of sb?
c)What is the calculated value of se?
d)In a few sentences, interpret se in the context of this problem.
e)Using the computer output above, perform the Model Utility Test at the .05 level of significance.
f)Construct a 95% confidence interval for β.
The estimated standard deviation, se, is roughly the magnitude of a typical deviation from the least squares regression line.
In the simple linear regression model, the randomness of e implies that y itself is subject to uncertainty.
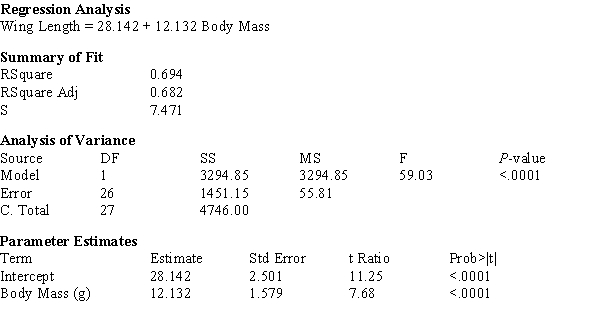
A study was carried out to investigate the relationship between x = the number of components needing repair and y = the time of the service call (in minutes) for a computer repair company. The number of components and the service times for a random sample of 20 service calls were used to fit a simple linear regression model. Partial computer output is shown below. ______________________________________________________________
The regression equation is Time = 32.441 + 11.6205 Number 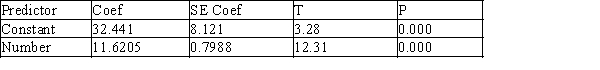
S=19/058, R- Sq=91.3%, R-Sq(adj)=90.0%
______________________________________________________________
One of the numbers in the above computer output indicates the number of additional minutes required per additional component serviced.
What is the value of this number?
S=19/058, R- Sq=91.3%, R-Sq(adj)=90.0%
______________________________________________________________
One of the numbers in the above computer output indicates the number of additional minutes required per additional component serviced.
What is the value of this number?
In a study of the surface temperatures of vital (living) and non-vital (dead) teeth in a random sample of 32 adults seeking dental care at a university clinic, temperatures of vital and non-vital teeth were measured for each individual. The computer output shown below was generated. 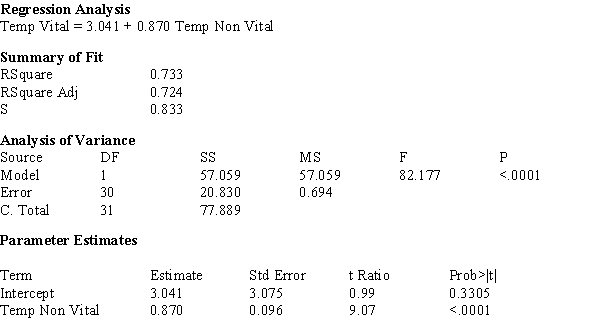
a)What proportion of observed variation in the surface temperature of vital teeth can be explained by the surface temperature of non-vital teeth?
b)Does the simple linear regression model appear to be useful? Justify your response with specific references to the computer output.
a)What proportion of observed variation in the surface temperature of vital teeth can be explained by the surface temperature of non-vital teeth?
b)Does the simple linear regression model appear to be useful? Justify your response with specific references to the computer output.
Filters
- Essay(0)
- Multiple Choice(0)
- Short Answer(0)
- True False(0)
- Matching(0)