Exam 10: Regression With Panel Data
Exam 1: Economic Questions and Data11 Questions
Exam 2: Review of Probability61 Questions
Exam 3: Review of Statistics56 Questions
Exam 4: Linear Regression With One Regressor54 Questions
Exam 5: Regression With a Single Regressor: Hypothesis Tests and Confidence Intervals53 Questions
Exam 6: Linear Regression With Multiple Regressors54 Questions
Exam 7: Hypothesis Tests and Confidence Intervals in Multiple Regression50 Questions
Exam 8: Nonlinear Regression Functions53 Questions
Exam 9: Assessing Studies Based on Multiple Regression55 Questions
Exam 10: Regression With Panel Data40 Questions
Exam 11: Regression With a Binary Dependent Variable40 Questions
Exam 12: Instrumental Variables Regression40 Questions
Exam 13: Experiments and Quasi-Experiments40 Questions
Exam 14: Introduction to Time Series Regression and Forecasting36 Questions
Exam 15: Estimation of Dynamic Causal Effects40 Questions
Exam 16: Additional Topics in Time Series Regression40 Questions
Exam 17: The Theory of Linear Regression With One Regressor39 Questions
Exam 18: The Theory of Multiple Regression38 Questions
Select questions type
'Empirical studies of economic growth are flawed because many of the truly important
underlying determinants, such as culture and institutions, are very hard to measure.'
Discuss this statement paying particular attention to simple cross-section data and panel
data models.Use equations whenever possible to underscore your argument.
(Essay)
4.8/5  (44)
(44)
The "before and after" specification, binary variable specification, and "entity- demeaned" specification produce identical OLS estimates
(Multiple Choice)
4.9/5 (42)
You learned in intermediate macroeconomics that certain macroeconomic growth models
predict conditional convergence or a catch up effect in per capita GDP between the
countries of the world.That is, countries which are further behind initially in per-capita
GDP will grow faster than the leader.You gather data from the Penn World Tables to test
this theory.
(a)By limiting your sample to 24 OECD countries, you hope to have a more homogeneous
set of countries in your sample, i.e., countries that are not too different with respect to
their institutions.To simplify matters, you decide to only test for unconditional
convergence.In that case, the laggards catch up even without taking into account
differences in some of the driving variables.Your scatter plot and regression for the time
period 1975-1989 are as follows: 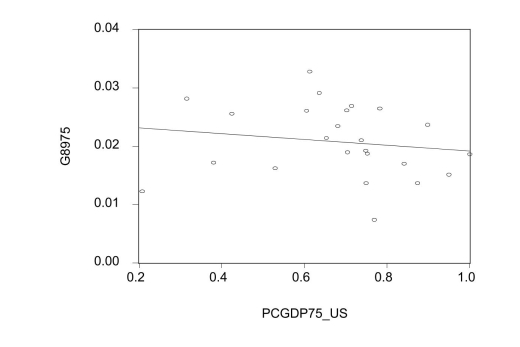 = 0.024-0.005PCGDP7US;=0.025,SER=0.006 (0.06)(0.008) where is the average annual growth rate of per capita GDP from 1975-1989, and PCGDP75_US is per capita GDP relative to the United States in 1975. Numbers in parenthesis are heteroskedasticity-robust standard errors. Interpret the results.Is there indication of unconditional convergence? What critical
value did you use?
= 0.024-0.005PCGDP7US;=0.025,SER=0.006 (0.06)(0.008) where is the average annual growth rate of per capita GDP from 1975-1989, and PCGDP75_US is per capita GDP relative to the United States in 1975. Numbers in parenthesis are heteroskedasticity-robust standard errors. Interpret the results.Is there indication of unconditional convergence? What critical
value did you use?
(Essay)
4.8/5 (39)
One of the following is a regression example for which Entity and Time Fixed Effects could be used: a study of the effect of
(Multiple Choice)
4.9/5 (32)
Consider the special panel case where T=2 . If some of the omitted variables, which you hope to capture in the changes analysis, in fact change over time, then the estimator on the included change regressor
(Multiple Choice)
4.9/5 (35)
(Requires Matrix Algebra)Consider the time and entity fixed effect model with a single
explanatory variable For the case of and , write this model in the form , where, in general,
How would the matrix change if you added two binary variables, and ? Demonstrate that in this case the columns of the matrix are not independent. Finally show that elimination of one of the two variables is not sufficient to get rid of the multicollinearity problem. In terms of the OLS estimator, , why does perfect multicollinearity create a problem?
(Essay)
5.0/5 (36)
Consider the regression example from your textbook, which estimates the effect of beer taxes on fatality rates across the 48 contiguous U.S.states.If beer taxes were set
Nationally by the federal government rather than by the states, then
(Multiple Choice)
4.8/5 (37)
With Panel Data, regression software typically uses an "entity-demeaned" algorithm because
(Multiple Choice)
4.7/5 (41)
(Requires Appendix material) When the fifth assumption in the Fixed Effects regression is violated, then
(Multiple Choice)
4.9/5 (26)
When you add state fixed effects to a simple regression model for U.S.states over a certain time period, and the regression R2 increases significantly, then it is safe to assume
That
(Multiple Choice)
4.8/5 (39)
Time Fixed Effects regression are useful in dealing with omitted variables
(Multiple Choice)
4.8/5 (32)
The main advantage of using panel data over cross sectional data is that it
(Multiple Choice)
4.9/5 (37)
A pattern in the coefficients of the time fixed effects binary variables may reveal the following in a study of the determinants of state unemployment rates using panel data:
(Multiple Choice)
5.0/5 (39)
A study attempts to investigate the role of the various determinants of regional Canadian
unemployment rates in order to get a better picture of Canadian aggregate unemployment
rate behavior.The annual data (1967-1991)is for five regions (Atlantic region, Quebec,
Ontario, Prairies, and British Columbia), and four age-gender groups (female and male,
adult and young).Focusing on young females, the authors find significant effects for the
following variables: the regional relative minimum wage rate (minimum wages divided
by average hourly earnings), the regional share of youth in the labor force, the regional
share of adult females in the labor force, United States activity shocks (deviations of
United States GDP from trend), an indicator of the degree of monetary tightness in
Canada, regional union density, and a regional index of unemployment insurance
generosity.Explain why the authors only used region fixed effects.How would their
specification have to change if they also employed time fixed effects?
(Essay)
4.8/5 (38)
Your textbook suggests an "entity-demeaned" procedure to avoid having to specify a
potentially large number of binary variables.While it is somewhat tedious to specify a
binary variable for each entity, this can still be handled relatively easily in the case of the
48 contiguous states.Give a few examples where it might be close to impossible to
implement specifying such large number of entity binary variables.The idea of the
"entity-demeaned" procedure was introduced as a computationally convenient and
simplifying procedure.Since there are also time fixed effects, why is there no discussion
of using a "time-demeaned" procedure? Using the following equation
(Essay)
4.8/5 (45)
Give at least three examples from macroeconomics and five from microeconomics that
involve specified equations in a panel data analysis framework.Indicate in each case
what the role of the entity and time fixed effects in terms of omitted variables might be.
(Essay)
4.8/5 (37)
In the Fixed Effects regression model, you should exclude one of the binary variables for the entities when an intercept is present in the equation
(Multiple Choice)
4.8/5 (41)
A study, published in 1993, used U.S.state panel data to investigate the relationship
between minimum wages and employment of teenagers.The sample period was 1977 to
1989 for all 50 states.The author estimated a model of the following type: where E is the employment to population ratio of teenagers, M is the nominal minimum
wage, and W is average hourly earnings in manufacturing.In addition, other explanatory
variables, such as the adult unemployment rate, the teenage population share, and the
teenage enrollment rate in school, were included.
(a)Name some of the factors that might be picked up by time and state fixed effects.
(Essay)
4.8/5 (45)
Filters
- Essay(0)
- Multiple Choice(0)
- Short Answer(0)
- True False(0)
- Matching(0)