Exam 3: Graphs and Functions
Exam 1: Review of Basic Concepts639 Questions
Exam 2: Equations and Inequalities496 Questions
Exam 3: Graphs and Functions522 Questions
Exam 4: Polynomial and Rational Functions508 Questions
Exam 5: Inverse, Exponential, and Logarithmic Functions472 Questions
Exam 6: Trigonometric Functions297 Questions
Exam 7: The Circular Functions and Their Graphs286 Questions
Exam 8: Trigonometric Identities and Equations492 Questions
Exam 9: Applications of Trigonometry447 Questions
Exam 10: Systems and Matrices507 Questions
Exam 11: Analytic Geometry217 Questions
Exam 12: Further Topics in Algebra348 Questions
Select questions type
The graph of y = f(x) is given. Use the graph to find the function value.
-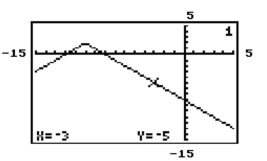 Find f(-3).
(Multiple Choice)
4.7/5  (31)
(31)
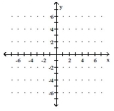
Graph the linear function and give the domain and the range. If the function is a constant function, identify it as such.
-
(Multiple Choice)
4.8/5 (46)
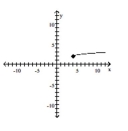
Describe the transformations and give the equation for the graph.
-
(Multiple Choice)
4.9/5 (31)
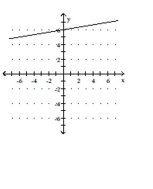
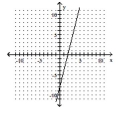
The graph of a linear function f is shown. Write the equation that defines f. Write the equation in slope-intercept form.
-
(Multiple Choice)
4.8/5 (32)
Determine whether the equation has a graph that is symmetric with respect to the y-axis, the x-axis, the origin, or none of
these.
-
(Multiple Choice)
4.7/5 (39)
Find the slope of the line satisfying the given conditions.
-through (3, -8) and (3, 6)
(Multiple Choice)
4.9/5 (41)
Provide an appropriate response.
-If the point (a, b) is in the fourth quadrant, in what quadrant is (a, -b)?
(Multiple Choice)
4.7/5 (32)
Describe how the graph of the equation relates to the graph of y
-![Describe how the graph of the equation relates to the graph of y y = \sqrt [ 3 ] { x } -](https://storage.examlex.com/TB7514/11ed7972_f443_5749_9733_d7532343c18f_TB7514_11.jpg)
(Multiple Choice)
4.8/5 (46)
The graph of a linear function f is shown. Identify the slope, y-intercept, and x-intercept.
-
(Multiple Choice)
4.8/5 (41)
Filters
- Essay(0)
- Multiple Choice(0)
- Short Answer(0)
- True False(0)
- Matching(0)