Exam 3: Graphs and Functions
Exam 1: Review of Basic Concepts639 Questions
Exam 2: Equations and Inequalities496 Questions
Exam 3: Graphs and Functions522 Questions
Exam 4: Polynomial and Rational Functions508 Questions
Exam 5: Inverse, Exponential, and Logarithmic Functions472 Questions
Exam 6: Trigonometric Functions297 Questions
Exam 7: The Circular Functions and Their Graphs286 Questions
Exam 8: Trigonometric Identities and Equations492 Questions
Exam 9: Applications of Trigonometry447 Questions
Exam 10: Systems and Matrices507 Questions
Exam 11: Analytic Geometry217 Questions
Exam 12: Further Topics in Algebra348 Questions
Select questions type
Give a rule for the piecewise-defined function. Then give the domain and range.
-
(Multiple Choice)
4.8/5  (28)
(28)
For the points P and Q, find the coordinates of the midpoint of the segment PQ.
-
(Multiple Choice)
4.8/5 (30)
Find the coordinates of the other endpoint of the segment, given its midpoint and one endpoint.
-The graph shows an idealized linear relationship for the average monthly payment to retirees from 1995 to 1999. Use the midpoint formula to estimate the average payment in 1997. Average Monthly Payment to Retirees
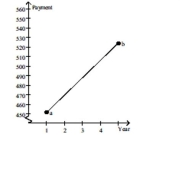 1995 1997 1999 a=\ 452;b=\ 524
(Multiple Choice)
4.8/5 (41)
Consider the function h as defined. Find functions f and g so that (f g)(x) = h(x).
-
(Multiple Choice)
4.9/5 (43)
Determine the largest open intervals of the domain over which the function is increasing, decreasing, and constant.
-
(Multiple Choice)
4.8/5 (40)
Determine whether (f g)(x) = x and whether (g f)(x) = x.
-
(Multiple Choice)
4.9/5 (37)
Provide an appropriate response.
-What is the distance from the point to the point ?
(Multiple Choice)
4.9/5 (34)
Determine whether the three points are the vertices of a right triangle.
-(-7, 4), (-1, 6), (3, -6)
(Multiple Choice)
4.8/5 (37)
Match the description with the correct symbolic expression.
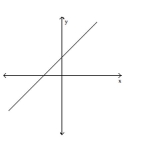
-a line with a negative slope
(Multiple Choice)
4.8/5 (34)
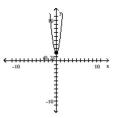
Choose the value which could represent the slope of the line. Assume that the scale on the x-axis is the same as the scale
on the y-axis.
-
(Multiple Choice)
4.7/5 (39)
A new chocolate company is estimating how many candy bars per week college students will consume of their line of
products. The graph shows the probable number of candy bars students (age 18-22) will consume from year 0 to year 10.
B(x) gives the number of candy bars for boys, G(x) gives the number of candy bars for girls, and T(x) gives the total
-A furniture store buys 105 footstools from a distributor at a cost of $225 each plus an overhead charge of $40 per order. The retail markup is 30% on the total price paid. Find the profit on the sale
Of one footstool.
(Multiple Choice)
4.9/5 (38)
Write all linear equations in slope-intercept form.
-Suppose that a sales person observes that if an item is priced at $10 per item then 7 items are sold. If x dollars per item. Find the slope-intercept form of the equation of the line.
(Multiple Choice)
4.9/5 (38)
Write all linear equations in slope-intercept form.
-A house was purchased for $65,000. After 6 years the value of the house was $119,000. Find a linear equation that models the value of the house after x years.
(Multiple Choice)
4.7/5 (40)
Filters
- Essay(0)
- Multiple Choice(0)
- Short Answer(0)
- True False(0)
- Matching(0)