Exam 3: Graphs and Functions
Exam 1: Review of Basic Concepts639 Questions
Exam 2: Equations and Inequalities496 Questions
Exam 3: Graphs and Functions522 Questions
Exam 4: Polynomial and Rational Functions508 Questions
Exam 5: Inverse, Exponential, and Logarithmic Functions472 Questions
Exam 6: Trigonometric Functions297 Questions
Exam 7: The Circular Functions and Their Graphs286 Questions
Exam 8: Trigonometric Identities and Equations492 Questions
Exam 9: Applications of Trigonometry447 Questions
Exam 10: Systems and Matrices507 Questions
Exam 11: Analytic Geometry217 Questions
Exam 12: Further Topics in Algebra348 Questions
Select questions type
Decide whether or not the equation has a circle as its graph. If it does not, describe the graph.
-
(Multiple Choice)
4.9/5  (32)
(32)
For the points P and Q, find the coordinates of the midpoint of the segment PQ.
-
(Multiple Choice)
4.8/5 (35)
Determine whether the three points are collinear.
-(5, 11), (-3, 6), (10, 19)
(Multiple Choice)
4.9/5 (43)
The line graph shows the recorded hourly temperatures in degrees Fahrenheit at an airport. 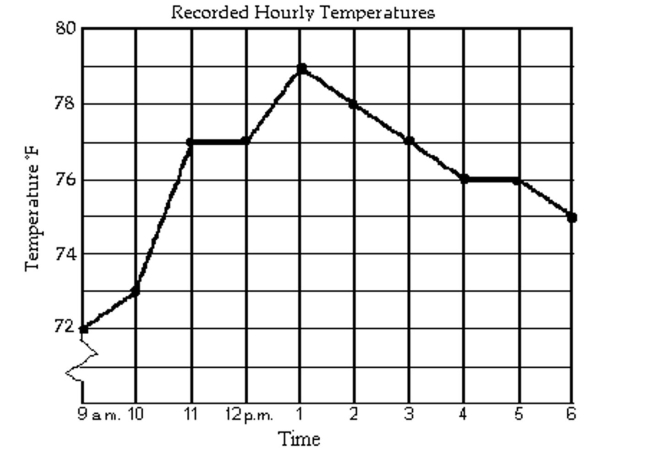 -During which two hour period did the temperature increase the most?
(Multiple Choice)
4.7/5 (35)
Match the description with the correct symbolic expression.
-a vertical line
(Multiple Choice)
4.9/5 (26)
Determine whether (f g)(x) = x and whether (g f)(x) = x.
-
(Multiple Choice)
4.7/5 (32)
The graph of y = f(x) is given. Use the graph to find the function value.
- Find f(-4).
(Multiple Choice)
4.7/5 (43)
Find the coordinates of the other endpoint of the segment, given its midpoint and one endpoint.
-midpoint (0, -5), endpoint (2, -4)
(Multiple Choice)
4.7/5 (41)
Provide an appropriate response.
-If a horizontal line is drawn through the point (5, -2), where will it intersect the y-axis?
(Multiple Choice)
4.8/5 (45)
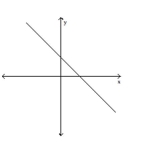
Choose the value which could represent the slope of the line. Assume that the scale on the x-axis is the same as the scale
on the y-axis.
-
(Multiple Choice)
4.9/5 (46)
The line graph shows the recorded hourly temperatures in degrees Fahrenheit at an airport.
-What temperature was recorded at 4 p.m.?
(Multiple Choice)
4.9/5 (36)
The figure below shows the graph of a function y = f(x). Use this graph to
-

(Multiple Choice)
4.8/5 (36)
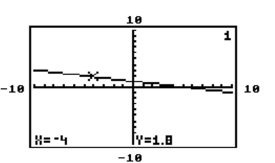
Rewrite the equation so that one side is 0, then replace 0 with y. The graph of the equation for y is shown.
Use a graphing calculator to solve the linear equation.
-
(Multiple Choice)
4.7/5 (42)
Filters
- Essay(0)
- Multiple Choice(0)
- Short Answer(0)
- True False(0)
- Matching(0)