Exam 3: Graphs and Functions
Exam 1: Review of Basic Concepts639 Questions
Exam 2: Equations and Inequalities496 Questions
Exam 3: Graphs and Functions522 Questions
Exam 4: Polynomial and Rational Functions508 Questions
Exam 5: Inverse, Exponential, and Logarithmic Functions472 Questions
Exam 6: Trigonometric Functions297 Questions
Exam 7: The Circular Functions and Their Graphs286 Questions
Exam 8: Trigonometric Identities and Equations492 Questions
Exam 9: Applications of Trigonometry447 Questions
Exam 10: Systems and Matrices507 Questions
Exam 11: Analytic Geometry217 Questions
Exam 12: Further Topics in Algebra348 Questions
Select questions type
Find the center-radius form of the circle described or graphed.
-Find the center-radius form of the equation of a circle with center and tangent to the -axis.
(Multiple Choice)
5.0/5  (33)
(33)
Write an equation for the line described. Give your answer in standard form.
-through , undefined slope
(Multiple Choice)
4.8/5 (35)
Give the domain and range of the relation.
-Annual New Telemarketing Companies
Year Number 1993 52 1994 102 1995 187 1996 170 1997 218
(Multiple Choice)
5.0/5 (44)
Graph the point symmetric to the given point.
-Plot the point , then plot the point that is symmetric to with respect to the origin.
(Multiple Choice)
4.8/5 (43)
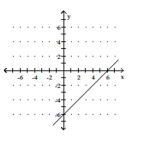
The graph of a linear function f is shown. Write the equation that defines f. Write the equation in slope-intercept form.
-
(Multiple Choice)
4.8/5 (44)
Describe how the graph of the equation relates to the graph of y
-Select the equation that describes the graph shown. ![Describe how the graph of the equation relates to the graph of y y = \sqrt [ 3 ] { x } -Select the equation that describes the graph shown.](https://storage.examlex.com/TB7514/11ed7973_0b2d_6e0c_9733_798d4bb0767a_TB7514_11.jpg)
(Multiple Choice)
4.7/5 (37)
Describe how the graph of the equation relates to the graph of y
-Select the equation that describes the graph shown.
![Describe how the graph of the equation relates to the graph of y y = \sqrt [ 3 ] { x } -Select the equation that describes the graph shown.](https://storage.examlex.com/TB7514/11ed7972_fca0_4d3a_9733_b37cb881ba85_TB7514_11.jpg)
(Multiple Choice)
4.9/5 (39)
Rewrite the equation so that one side is 0, then replace 0 with y. The graph of the equation for y is shown.
Use a graphing calculator to solve the linear equation.
-
(Multiple Choice)
4.9/5 (38)
The line graph shows the recorded hourly temperatures in degrees Fahrenheit at an airport. 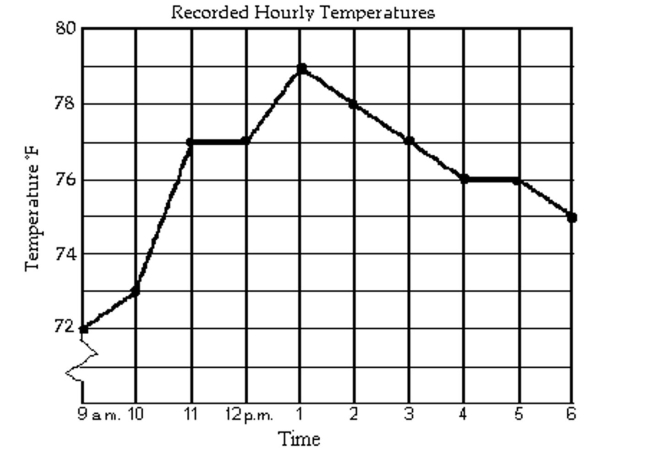 -At what times was the temperature below 77°F?
(Multiple Choice)
4.8/5 (41)
Rewrite the equation so that one side is 0, then replace 0 with y. The graph of the equation for y is shown.
Use a graphing calculator to solve the linear equation.
-
(Multiple Choice)
4.7/5 (45)
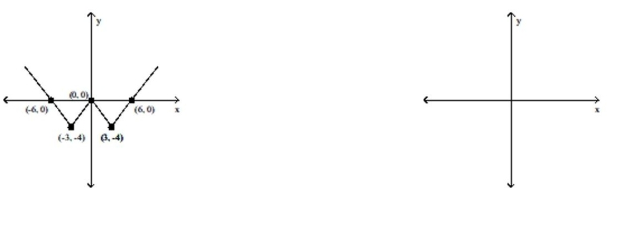
Determine the intervals of the domain over which the function is continuous.
-
(Multiple Choice)
5.0/5 (34)
The figure below shows the graph of a function y = f(x). Use this graph to
-
(Multiple Choice)
4.8/5 (34)
Decide whether the relation defines a function.
- Student Test Score Name Test Score Bob L. 79 Susan H. 83 Jim H. 79 Bruce B. 96
(Multiple Choice)
4.7/5 (36)
Filters
- Essay(0)
- Multiple Choice(0)
- Short Answer(0)
- True False(0)
- Matching(0)