Exam 4: Random Variables and Probability Distributions
Exam 1: Statistics, Data, and Statistical Thinking74 Questions
Exam 2: Methods for Describing Sets of Data188 Questions
Exam 3: Probability237 Questions
Exam 4: Random Variables and Probability Distributions273 Questions
Exam 5: Sampling Distributions52 Questions
Exam 6: Inferences Based on a Single Sample: Estimation With Confidence Intervals135 Questions
Exam 7: Inferences Based on a Single Sample: 355 Tests of Hypotheses144 Questions
Exam 8: Inferences Based on Two Samples: Confidence Intervals and Tests of Hypotheses102 Questions
Exam 9: Design of Experiments and Analysis of Variance87 Questions
Exam 10: Categorical Data Analysis59 Questions
Exam 11: Simple Linear Regression113 Questions
Exam 12: Multiple Regression and Model Building131 Questions
Exam 13: Methods for Quality Improvement: Statistical Process Control Available on CD89 Questions
Exam 14: Time Series: Descriptive Analyses, Models, and Forecasting Available on CD73 Questions
Exam 15: Nonparametric Statistics Available on CD49 Questions
Select questions type
Suppose is a random variable best described by a uniform probability distribution with and . Find .
(Multiple Choice)
4.8/5  (38)
(38)
The university police department must write, on average, five tickets per day to keep department revenues at budgeted levels. Suppose the number of tickets written per day follows a Poisson distribution with a mean of 8.9. Find the probability that exactly four tickets are written on a randomly selected day.
(Multiple Choice)
4.8/5 (33)
Suppose that the random variable has an exponential distribution with . Find the probability that will assume a value within the interval .
(Multiple Choice)
4.9/5 (31)
Which one of the following suggests that the data set is approximately normal?
(Multiple Choice)
4.8/5 (38)
Which binomial probability is represented on the screen below?
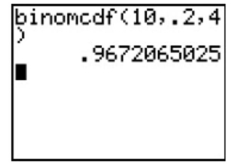
(Multiple Choice)
4.9/5 (37)
Suppose a random variable is best described by a normal distribution with and . Find the -score that corresponds to the value .
(Multiple Choice)
4.9/5 (29)
Suppose a man has ordered twelve 1-gallon paint cans of a particular color (lilac) from the local paint store in order to paint his mother's house. Unknown to the man, three of these cans contains an incorrect mix of paint. For this weekend's big project, the man randomly selects four of these 1-gallon cans to paint his mother's living room. Let the number of the paint cans selected that are defective. Unknown to the man, follows a hypergeometric distribution. Find the probability that at least one of the four cans selected contains an incorrect mix of paint.
(Multiple Choice)
4.8/5 (42)
Explain why the following is or is not a valid probability distribution for the discrete random variable x.
x 10 20 30 40 50 p(x) .3 .2 .2 .2 .2
(Essay)
4.8/5 (45)
Suppose is a uniform random variable with and . Find the mean of the random variable .
(Essay)
4.8/5 (28)
Which one of the following suggests that the data set is not approximately normal?
(Multiple Choice)
4.8/5 (30)
The length of time (in months) that a cashier works for a certain fast food restaurant is exponentially distributed with a mean of 7 months.
a. Find the probability that a cashier works for the restaurant for at least 2 years.
b. Find the probability that a cashier works for the restaurant for less than 1 month.
(Essay)
4.8/5 (32)
Assume that is a binomial random variable with and . Use a normal approximation to find .
(Multiple Choice)
4.8/5 (38)
A statistician received some data to analyze. The sender of the data suggested that the data was normally distributed. Which of the following methods can be used to determine if the data is, in fact, normally distributed?
I. Construct a histogram and/or stem-and-leaf display of the data and check the shape.
II. Compute the intervals , and , and determine the percentage of measurements falling in each. Compare these percentages to , and .
III. Calculate a value of . If this value is approximately , then the data is normal.
IV. Construct a normal probability plot of the data. If the points fall on a straight line, then the data is normal.
(Multiple Choice)
4.8/5 (46)
For a standard normal random variable, find the probability that z exceeds the value
(Multiple Choice)
4.9/5 (32)
A recent article in the paper claims that business ethics are at an all-time low. Reporting on a recent sample, the paper claims that 41% of all employees believe their company president possesses low ethical standards. Suppose 20 of a company's employees are randomly and independently sampled and asked if they believe their company president has low ethical standards and their years of experience at the company. Could the probability distribution for the number of years of experience be modelled by a binomial probability distribution?
(Multiple Choice)
4.8/5 (39)
It a recent study of college students indicated that 30% of all college students had at least one tattoo. A small private college decided to randomly and independently sample 15 of their students and ask if they have a tattoo. Use a binomial probability table to find the probability that exactly 5 of the students reported that they did have at least one tattoo.
(Multiple Choice)
4.9/5 (44)
Filters
- Essay(0)
- Multiple Choice(0)
- Short Answer(0)
- True False(0)
- Matching(0)