Exam 4: Random Variables and Probability Distributions
Exam 1: Statistics, Data, and Statistical Thinking74 Questions
Exam 2: Methods for Describing Sets of Data188 Questions
Exam 3: Probability237 Questions
Exam 4: Random Variables and Probability Distributions273 Questions
Exam 5: Sampling Distributions52 Questions
Exam 6: Inferences Based on a Single Sample: Estimation With Confidence Intervals135 Questions
Exam 7: Inferences Based on a Single Sample: 355 Tests of Hypotheses144 Questions
Exam 8: Inferences Based on Two Samples: Confidence Intervals and Tests of Hypotheses102 Questions
Exam 9: Design of Experiments and Analysis of Variance87 Questions
Exam 10: Categorical Data Analysis59 Questions
Exam 11: Simple Linear Regression113 Questions
Exam 12: Multiple Regression and Model Building131 Questions
Exam 13: Methods for Quality Improvement: Statistical Process Control Available on CD89 Questions
Exam 14: Time Series: Descriptive Analyses, Models, and Forecasting Available on CD73 Questions
Exam 15: Nonparametric Statistics Available on CD49 Questions
Select questions type
A discrete random variable x can assume five possible values: 2, 3, 5, 8, 10. Its probability distribution is shown below. Find the probability that the random variable x is a value greater than 5.
2 3 5 8 10 () 0.10 0.20 0.30 0.30 0.10
(Multiple Choice)
4.9/5  (44)
(44)
A dice game involves rolling three dice and betting on one of the six numbers that are on the dice. The game costs $7 to play, and you win if the number you bet appears on any of the dice. The distribution for the outcomes of the game (including the profit) is shown below: Number of dice with your number Profit Probability 0 -\ 7 125/216 1 \ 7 75/216 2 \ 9 15/216 3 \ 21 1/216
Find your expected profit from playing this game.
(Multiple Choice)
4.8/5 (25)
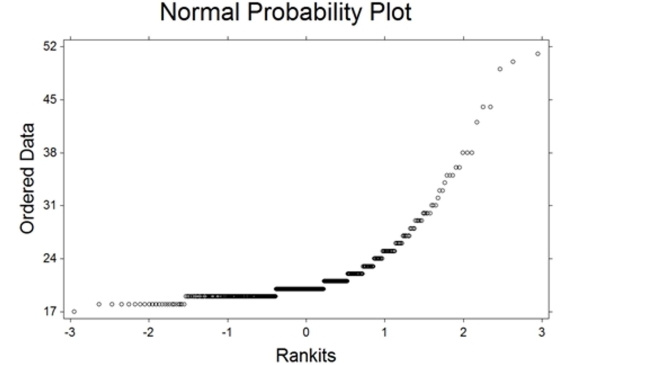
Data has been collected and a normal probability plot for one of the variables is shown below. Based on your knowledge of normal probability plots, do you believe the variable in question is normally distributed? The data are represented by the"o" symbols in the plot.
(Multiple Choice)
4.8/5 (40)
The volume of soda a dispensing machine pours into a 12-ounce can of soda follows a normal distribution with a mean of 12.30 ounces and a standard deviation of 0.20 ounce. The company receives complaints from consumers who actually measure the amount of soda in the cans and claim that the volume is less than the advertised 12 ounces. What proportion of the soda cans
Contain less than the advertised 12 ounces of soda?
(Multiple Choice)
4.8/5 (29)
Given that is a hypergeometric random variable with , and :
a. Display the probability distribution in tabular form.
b. Compute and for .
c. What is the probability that will fall within the interval
(Essay)
4.8/5 (39)
The age of customers at a local hardware store follows a uniform distribution over the interval from 18 to 60 years old. Find the average age of customers to this hardware store.
(Multiple Choice)
4.9/5 (41)
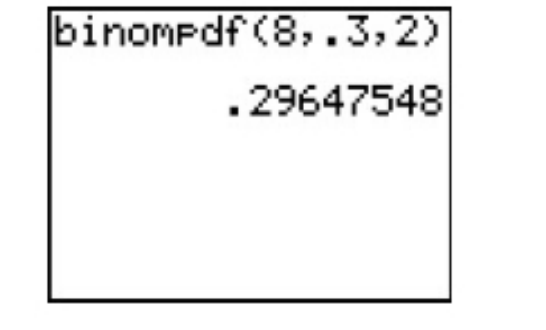
Which binomial probability is represented on the screen below?
(Multiple Choice)
4.8/5 (38)
A recent survey found that 61% of all adults over 50 wear glasses for driving. In a random sample of 70 adults over 50, what is the mean and standard deviation of the number who wear glasses? round to the nearest hundredth when necessary.
(Multiple Choice)
4.8/5 (40)
Assume that is a binomial random variable with and . Use a normal approximation to find .
(Multiple Choice)
4.8/5 (31)
We believe that 90% of the population of all Business Statistics students consider statistics to be an exciting subject. Suppose we randomly and independently selected 23 students from the population and observed fewer than five in our sample who consider statistics to be an exciting subject. Make an inference about the belief that 90% of the students consider statistics to be an exciting subject.
(Multiple Choice)
4.7/5 (36)
Classify the following random variable according to whether it is discrete or continuous. The temperature in degrees Fahrenheit on July 4th in Juneau, Alaska
(Multiple Choice)
4.7/5 (30)
An alarm company reports that the number of alarms sent to their monitoring center from customers owning their system follow a Poisson distribution with alarms per year. Find the probability that a randomly selected customer had more than 7 alarms reported.
(Multiple Choice)
4.9/5 (29)
The university police department must write, on average, five tickets per day to keep department revenues at budgeted levels. Suppose the number of tickets written per day follows a Poisson distribution with a mean of 8.5. Interpret the value of the mean.
(Multiple Choice)
4.7/5 (38)
Suppose a random variable is best described by a normal distribution with and . Find the -score that corresponds to the value .
(Multiple Choice)
4.9/5 (40)
A study of college students stated that 25% of all college students have at least one tattoo. In a random sample of 80 college students, let x be the number of the students that have at least one tattoo. Find the approximate probability that more than 30 of the sampled students had at least one tattoo.
(Multiple Choice)
4.9/5 (34)
Suppose x is a random variable for which a Poisson probability distribution
with 3 provides a good approximation.
a. Graph for .
b. Find and for .
c. What is the probability that will fall in the interval ?
(Essay)
4.8/5 (38)
Classify the following random variable according to whether it is discrete or continuous. The number of phone calls to the attendance office of a high school on any given school day
(Multiple Choice)
5.0/5 (37)
Filters
- Essay(0)
- Multiple Choice(0)
- Short Answer(0)
- True False(0)
- Matching(0)