Exam 14: Descriptive Methods in Regression and Correlation
Exam 1: The Nature of Statistics88 Questions
Exam 2: Organizing Data169 Questions
Exam 3: Descriptive Measures195 Questions
Exam 4: Probability Concepts133 Questions
Exam 5: Discrete Random Variables163 Questions
Exam 6: The Normal Distribution144 Questions
Exam 7: The Sampling Distribution of the Sample Mean76 Questions
Exam 8: Confidence Intervals for One Population Mean84 Questions
Exam 9: Hypothesis Tests for One Population Mean58 Questions
Exam 10: Inferences for Two Population Means103 Questions
Exam 11: Inferences for Population Standard Deviations101 Questions
Exam 12: Inferences for Population Proportions104 Questions
Exam 13: Chi-Square Procedures74 Questions
Exam 14: Descriptive Methods in Regression and Correlation55 Questions
Exam 15: Inferential Methods in Regression and Correlation41 Questions
Exam 16: Analysis of Variance Anova71 Questions
Select questions type
Anne is running a 400-meter race. She runs at a constant speed of 7.5 meters per second. If you let y denote her distance in meters from the finish line x seconds after the start of the race, y = 400 - 7.5x. Determine b0 and b1 for this linear equation. Find Anne's distance from the finish line 10, 24, and 43 seconds after the race begins. Use these three points to graph the linear equation y = 400 - 7.5x. Use the graph to estimate visually Anne's distance from the finish line 32 seconds after the start of the race. 
(Essay)
4.8/5  (36)
(36)
A car mechanic tells a client that it will cost $120 for parts plus $50 per hour for labor to fix her car. Let x denote the number of hours of labor and let y denote the total cost to fix the car. Obtain the equation that expresses y in terms of x. Construct a table of values using the x-values 2, 3, and 5 hours. Draw the graph of the equation by plotting the points from the table and connecting them with a straight line. Use the graph to estimate visually the total cost of fixing the car if the number of hours of labor is 3.5. 
(Essay)
4.9/5 (41)
The table below shows the age and annual income of 12 randomly selected college graduates all living in the city of Seattle.
Age Annual Income (dollars 26 28,520 31 36,750 55 72,155 47 43,225 38 34,197 50 60,030 29 25,005 23 31,625 33 55,975 40 37,064 52 75,082 25 19,055 The scatterplot and regression line are graphed below:
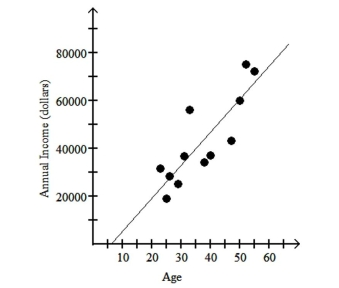 Would it be reasonable to use the regression equation to predict the annual income of a college Graduate in Seattle who is 90 years old? Explain your answer.
(Multiple Choice)
4.8/5 (36)
The regression equation for the given data points is provided. Graph the regression equation and the data points.^y
- 1 3 5 7 9 73 46 30 28 20
(Multiple Choice)
4.9/5 (28)
For the linear equation , explain what the -intercept and slope represent in terms of the graph of the equation.
(Multiple Choice)
4.8/5 (34)
Determine the regression equation for the data. Round the final values to three significant digits, if necessary.
- 0 3 4 5 12 8 2 6 9 12
(Multiple Choice)
4.9/5 (33)
The y-intercept and slope, respectively, of a straight line are given. Find the equation of the line.
--9 and 4
(Multiple Choice)
4.8/5 (36)
Give an example of a linear equation whose graph is a horizontal line.
(Essay)
4.9/5 (28)
You are given information about a straight line. Determine whether the line slopes upward, slopes downward, or ishorizontal.
-The y-intercept is 0 and the slope is -5.2.
(Multiple Choice)
4.8/5 (31)
Determine the percentage of variation in the observed values of the response variable that is explained by the regression.Round to the nearest tenth of a percent if needed.
- x 9 2 3 4 2 5 9 10 y 85 52 55 68 67 86 83 73
(Multiple Choice)
4.9/5 (32)
In the context of regression analysis, the coefficient of determination is the proportion
of variation in the observed values of the response variable not explained by the regression
(True/False)
4.8/5 (35)
For a particular regression analysis, it is found that SST = 901 and SSE = 804.1. Does the regression equation appear to be useful for making predictions? How can you tell?
(Essay)
4.8/5 (35)
Explain how to obtain the straight-line graph of the linear equation . Be sure to specify which x-values you would use and what the corresponding points on the line are. Would this method work for an equation whose graph is not a straight line? Why or why not?
(Essay)
4.7/5 (41)
Suppose data are collected for each of several randomly selected adults for height, in inches, and number of calories burned in 30 minutes of walking on a treadmill at 3.5 mph. How would the value of the linear correlation coefficient, r, change if all of the heights were converted to meters?
(Essay)
4.7/5 (40)
Obtain the linear correlation coefficient for the data. Round your answer to three decimal places.
-Two separate tests, x and y, are designed to measure a student's ability to solve problems. Several students are randomly selected to take both tests and their results are shown below. 48 52 58 44 43 43 40 51 59 73 67 73 59 58 56 58 64 74
(Multiple Choice)
4.8/5 (41)
A set of data consists of the number of years that applicants for foreign service jobs have studied German and the grades that they receive on a proficiency test. The following regression equation is obtained: , where represents the number of years of study and y represents the grade on the test. What does the slope of the regression line represent in terms of grade on the test?
(Essay)
4.8/5 (41)
Compute the coefficient of determination. Round your answer to four decimal places.
-The regression equation for the data below is .
2 4 5 6 7 11 13 20
(Multiple Choice)
4.8/5 (41)
For a particular regression analysis, the following regression equation is obtained: . Furthermore, the coefficient of determination is . How useful would the regression equation be for making predictions? How can you tell?
(Essay)
4.9/5 (39)
The y-intercept and slope, respectively, of a straight line are given. Find the equation of the line.
-0 and
(Multiple Choice)
4.9/5 (45)
Filters
- Essay(0)
- Multiple Choice(0)
- Short Answer(0)
- True False(0)
- Matching(0)