Exam 16: Analysis of Variance Anova
Exam 1: The Nature of Statistics88 Questions
Exam 2: Organizing Data169 Questions
Exam 3: Descriptive Measures195 Questions
Exam 4: Probability Concepts133 Questions
Exam 5: Discrete Random Variables163 Questions
Exam 6: The Normal Distribution144 Questions
Exam 7: The Sampling Distribution of the Sample Mean76 Questions
Exam 8: Confidence Intervals for One Population Mean84 Questions
Exam 9: Hypothesis Tests for One Population Mean58 Questions
Exam 10: Inferences for Two Population Means103 Questions
Exam 11: Inferences for Population Standard Deviations101 Questions
Exam 12: Inferences for Population Proportions104 Questions
Exam 13: Chi-Square Procedures74 Questions
Exam 14: Descriptive Methods in Regression and Correlation55 Questions
Exam 15: Inferential Methods in Regression and Correlation41 Questions
Exam 16: Analysis of Variance Anova71 Questions
Select questions type
Perform a Kruskal-Wallis test using the critical-value approach.
-The table below shows the lifetimes (in hours)of random samples of light bulbs of three different brands. At the 0.01 significance level, do the data provide sufficient evidence to conclude that a difference exists between the three population means? Brand A Brand B Brand C 190 182 203 220 170 210 230 203 199 215 175 200 224 178 196 231 181 197
Free
(Essay)
4.9/5  (37)
(37)
Correct Answer: Verified
: Not all the means are equal. Test statistic: . Critical value is 9.210. Reject the null hypothesis. The data provide sufficient evidence to conclude that a difference exists between the three population means.
A one-way ANOVA is being performed. Suppose that SST = 94.8 and SSTR = 54.6. Find the value of the third sum of squares, give its notation, state its name and the source of variation it represents.
Free
(Essay)
4.8/5 (38)
Correct Answer:Verified
SSE = 40.2. SSE = error sum of squares and represents the variation within samples.
A Tukey multiple comparison is being performed to compare the means of three populations. If the family confidence level is 95%, of what can we be 95% confident?
Free
(Essay)
4.9/5 (42)
Correct Answer:Verified
We can be 95% confident that all the confidence intervals contain the differences between the corresponding population means.
Conduct a Tukey multiple comparison. Display the confidence intervals in a table. State which population means can bedeclared different.
-Use a 95% family confidence level. Sample 1 Sample 2 Sample 3 5 9 5 4 8 6 9 10 3
(Essay)
4.8/5 (33)
Find the required F-value.
-An F-curve has df = (6, 20). Find the F-value having area 0.10 to its right.
(Multiple Choice)
4.8/5 (33)
In a one-way ANOVA, if the null hypothesis is rejected, we conclude that the
population means are all different (i.e., no two of the population means are equal).
(True/False)
4.8/5 (34)
Use Minitab to perform a Kruskal-Wallis test using the P-value approach.
-The table below shows the lifetimes (in hours)of random samples of light bulbs of three different brands. At the 0.01 significance level, do the data provide sufficient evidence to conclude that a difference exists between the three population means? Brand A Brand B Brand C 190 182 203 220 170 210 230 203 199 215 175 200 224 178 196 231 181 197
(Essay)
4.7/5 (40)
Perform a Kruskal-Wallis test using the critical-value approach.
-A fire-science specialist tests three different brands of flares for their burning times (in minutes)and the results are given below for the sample data. At the 0.05 significance level, do the data provide sufficient evidence to conclude that a difference exists between the mean burn times of the three different brands? Use the Kruskal-Wallis test. Brand X 16.4 17.6 18.3 17.0 17.1 17.3 Brand Y 17.9 18.0 17.8 18.4 17.6 19.0 19.1 Brand Z 17.3 16.4 16.5 16.0 15.8 16.3 17.1
(Essay)
4.8/5 (43)
For an F-curve with df = (10, 20), find the F-value having area 0.01 to its right and illustrate your answer with a sketch.
(Essay)
4.8/5 (34)
Preliminary data analyses indicate that it is reasonable to consider the assumptions for one-way ANOVA satisfied.Perform the required hypothesis test using the critical-value approach.
-At the 0.01 significance level, do the data provide sufficient evidence to conclude that a difference exists between the population means of the three different brands ? The sample data are given below. 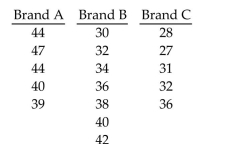
(Essay)
4.7/5 (37)
Find the required F-value.
-An -curve has . Find the -value having area to its right.
(Multiple Choice)
4.8/5 (28)
A Tukey multiple comparison is performed to compare the means of four populations. The sample sizes are , and 14 . Determine the parameters and for the appropriate -curve.
(Multiple Choice)
4.9/5 (31)
For an F-curve with df = (8, 3), find the F-value having area 0.05 to its right and illustrate your answer with a sketch.
(Essay)
4.8/5 (22)
Fill in the missing entries in the partially completed one-way ANOVA table.
-Describe the null and alternate hypotheses for one-way ANOVA. Give an example.
(Essay)
4.7/5 (43)
Preliminary data analyses indicate that it is reasonable to consider the assumptions for one-way ANOVA satisfied.Perform the required hypothesis test using the critical-value approach.
-At the 0.025 significance level, do the data provide sufficient evidence to conclude that a difference exists between the population means of the four different brands? The sample data are given below. 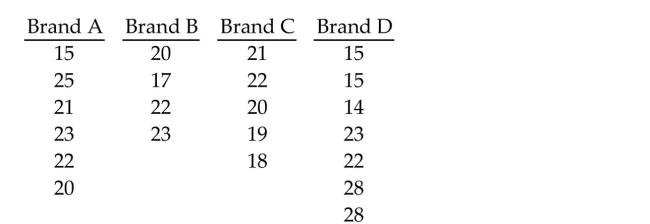
(Essay)
4.9/5 (50)
Compute the sum of squares.
-A one-way ANOVA is to be performed. Independent random samples are selected from three different populations. The sample data are given in the table below.
Sample 1 Sample 2 Sample 3 5 3 2 9 7 1 7 3 8
Compute the treatment sum of squares, SSTR.
(Multiple Choice)
4.9/5 (30)
Use Minitab to perform a Kruskal-Wallis test using the P-value approach.
-The table below shows the weights (in pounds)of 6 randomly selected women in each of three different age groups. At the 0.01 significance level, do the data provide sufficient evidence to conclude that a difference exists between the three population means? 18-34 35-55 56 and older 119 123 140 134 147 128 114 135 159 125 110 134 153 154 120 138 163 116
(Essay)
4.9/5 (47)
When performing a one-way ANOVA, two of the assumptions required are that the populations be normally distributed and that the populations have equal standard deviations. What rule of thumb can be used to assess the equal-standard deviations assumption? What other method can be used to assess the normality and equal-standard deviations assumptions?
(Essay)
4.7/5 (32)
A researcher wants to perform either a Kruskal-Wallis test or a one-way ANOVA to compare four population means. Independent samples of sizes 7, 6, 10, and 8 are selected from the four populations. The variable under consideration is normally distributed on each of the four populations and the population standard deviations are equal. Are the assumptions for the one-way ANOVA met? Are the assumptions for the Kruskal-Wallis test met? Which test is preferable? Why?
(Essay)
4.9/5 (34)
Filters
- Essay(0)
- Multiple Choice(0)
- Short Answer(0)
- True False(0)
- Matching(0)