Exam 9: Hypothesis Tests for One Population Mean
Provide an appropriate response.
-A right-tailed hypothesis test for a population mean is to be performed. If the null hypothesis is rejected at the 5% level of significance, does this necessarily mean that it would be rejected at the 1% level of significance? at the 10% level of significance? Explain your reasoning. In your explanation, refer to the critical values corresponding to the different significance levels.
A null hypothesis which is rejected at the 5% level of significance will certainly be rejected at the 10% level of significance but not necessarily at the 1% level of significance. If the null hypothesis is rejected at the 5% level of significance, the test statistic is greater than the critical value of 1.645. This means that the test statistic is certainly greater than 1.28 which is the critical value corresponding to a 10% level of significance. The test statistic is not necessarily greater than 2.33 which is the critical value corresponding to a 1% level of significance.
When performing a one-sample z-test for a population mean, what criterion do you use for rejecting the null hypothesis using the critical value approach? using the P-value approach? Assume that a right-tailed test is being performed.
Using the critical value approach, the null hypothesis is rejected if the test statistic is greater than the critical value. Using the P-value approach, the null hypothesis is rejected if the P-value is smaller than the significance level.
Solve the problem. Use the critical-value approach.
-A hypothesis test for a population mean is to be performed. If the sample size is small (less than 15), under what conditions is it reasonable to use the z-test? If the sample size is moderate (between 15 and 30), under what conditions is it reasonable to use the z-test?
If the sample size is small, the z-test should only be used if the variable under consideration is normally distributed or close to being so. If the sample size is moderate, the z-test can be used unless the data contain outliers or the variable under consideration is far from being normally distributed.
Preliminary data analyses indicate that it is reasonable to use a t-test to carry out the specified hypothesis test. Performthe t-test using the P-value approach.
-Test whether the mean weight of female college students differs from . The mean weight for a random sample of 20 female college students was with a standard deviation, s, of . Use a significance level of .
Preliminary data analyses indicate that it is reasonable to use a t-test to carry out the specified hypothesis test. Performthe t-test using the P-value approach.
-Use a significance level of to test whether differs from12.3. The sample data consist of 20 scores for which and . State the null and alternative hypotheses, compute the value of the test statistic, and find the P-value. State your conclusion.
Construct a graph portraying the decision criterion for the specified hypothesis test.
-A hypothesis test for a population mean is conducted. The hypotheses are: :\mu= :\mu The significance level is 0.06 and the critical values are -1.88 and 1.88. Sketch a normal curve displaying the decision criterion. This curve will represent the normal curve for the test statistic under the assumption that the null hypothesis is true. On your graph indicate the area in each tail, the critical values, the rejection region, and the nonrejection region.
A hypothesis test for a population mean is to be performed. Suppose that the sample size is 50 but that the data contain outliers. Is it reasonable to use the z-test? How should you proceed?
Suppose that you wish to use a Wilcoxon signed-rank test to perform a hypothesis test for a population mean. If the absolute differences contain ties, how should you assign the ranks? For example if two absolute differences are tied for fourth place, what ranks should they receive? If three absolute differences are tied for eighth place, what ranks should they receive?
A hypothesis test for a population mean is to be performed. The hypotheses are :\mu=60 :\mu>60.
The significance level is and . Assume that the true mean is greater than 60 (i.e., the null hypothesis is false). If you are given the value of the true mean, , how would you find the power of the test? Outline the steps involved.
Two graphical displays are given for a set of data. A hypothesis test is to be performed for the mean of the populationfrom which the data were obtained. Would it be reasonable to use a one-mean z-test? Explain your reasoning. Assumethat the population standard deviation is known.
-A normal probability plot and a stem-and-leaf diagram of the data are given below. 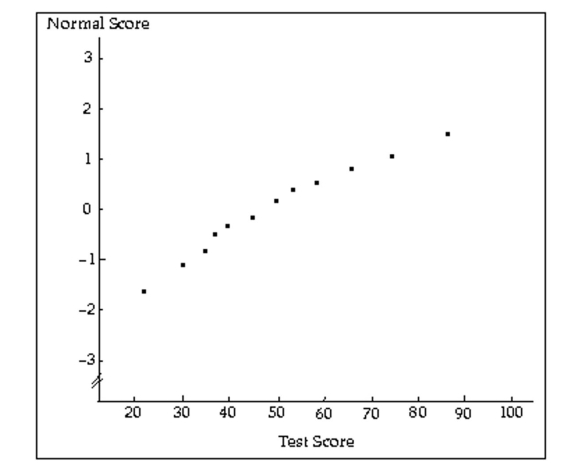 2 2 3 047 4 059 5 38 6 5 7 4 8 7
Outline the six steps involved in performing a one-sample z-test for a population mean.
Perform a one-sample z-test for a population mean using the P-value approach. Be sure to state the hypotheses and thesignificance level, to compute the value of the test statistic, to obtain the P-value, and to state your conclusion. Also,assess the strength of the evidence against the null hypothesis.
-In one city, the average amount of time that tenth-graders spend watching television each week is 21.6 hours. The principal of Birchwood High School believes that at his school, tenth-graders watch less television. For a sample of 28 tenth-graders from Birchwood High School, the mean amount of time spent watching television per week was 19.4 hours. Do the data provide sufficient evidence to conclude that for tenth-graders at Birchwood High School, the mean amount of time spent watching television per week is less than the city average of 21.6 hours? Perform the appropriate hypothesis test using a significance level of 5%. Assume that = 7.2 hours.
Provide an appropriate response.
-Give an example of a hypothesis test for which it is important to have a small β probability. Explain why it is important to have a small value for
Preliminary data analyses indicate that it is reasonable to use a t-test to carry out the specified hypothesis test. Performthe t-test using the P-value approach.
-DuraBurn claims that the mean lifetime of its SuperGlo light bulbs is 904 hours. A researcher wants to perform a hypothesis test to determine whether the mean lifetime is actually less than this. A random sample of 10 DuraBurn SuperGlo bulbs exhibited an average lifetime hours with a standard deviation hours. Using the hypotheses
:\mu=904 :\mu<904
compute the value of the test statistic, and find the P-value for the sample. State your conclusion. Use a significance level of 0.05.
Construct a graph portraying the decision criterion for the specified hypothesis test.
-A one-sample z-test for a population mean is to be performed. Why might it be more useful for those interpreting the results to know the P-value rather than simply whether or not the null hypothesis was rejected?
Provide an appropriate response.
-List the advantages and disadvantages of nonparametric tests.
A high school biology student wishes to test the hypothesis that hummingbird feeders can affect the mean mass of ruby-throated hummingbirds in the area surrounding the feeder. She captures
And weighs several of the hummingbirds near a science museum where several feeders are located.
She obtains the following masses in grams: 4.4 3.9 4.5 4.3 4.1 3.8 3.8 4.1 3.9 3.8 3.2 4.3
3.8 4.1 3.9 3.8 3.2 4.3
The student's hypotheses are:
:\mu=3.65 :\mu>3.65
Use technology to calculate the P-value, then determine whether the data provide sufficient evidence to conclude that the mean mass of the birds in the area surrounding the feeder is greater than the mean mass of the general population. Test at the significance level and assume that the population standard deviation is . Also, assess the strength of the evidence against the null hypothesis.
Use the Wilcoxon signed-rank test to perform the required hypothesis test. Be sure to state the hypotheses and thesignificance level, to obtain the critical value(s), to compute the value of the test statistic, and to state your conclusion.
-The forced vital capacity (FVC)is often used by physicians to assess a person's ability to move air in and out of their lungs. It is the maximum amount of air that can be exhaled after a deep breath. For adult males, the average FVC is 5.0 liters. A researcher wants to perform a hypothesis test to determine whether the average forced vital capacity for women differs from this value. A random sample of 12 women yielded the following values for FVC, in liters.
4.7 4.5 5.2 5.1 4.0 5.4 4.1 3.7 3.2 4.3 4.4 3.5 At the 1% significance level, do the data provide sufficient evidence to conclude that the mean forced vital capacity for women differs from the mean value for men of 5.0 liters?
Traditionally in hypothesis testing the null hypothesis represents the "status quo" which will be overturned only if there is evidence against it. Which of the statements below might represent a
Null hypothesis?
Filters
- Essay(0)
- Multiple Choice(0)
- Short Answer(0)
- True False(0)
- Matching(0)