Exam 2: Organizing Data
Exam 1: The Nature of Statistics88 Questions
Exam 2: Organizing Data169 Questions
Exam 3: Descriptive Measures195 Questions
Exam 4: Probability Concepts133 Questions
Exam 5: Discrete Random Variables163 Questions
Exam 6: The Normal Distribution144 Questions
Exam 7: The Sampling Distribution of the Sample Mean76 Questions
Exam 8: Confidence Intervals for One Population Mean84 Questions
Exam 9: Hypothesis Tests for One Population Mean58 Questions
Exam 10: Inferences for Two Population Means103 Questions
Exam 11: Inferences for Population Standard Deviations101 Questions
Exam 12: Inferences for Population Proportions104 Questions
Exam 13: Chi-Square Procedures74 Questions
Exam 14: Descriptive Methods in Regression and Correlation55 Questions
Exam 15: Inferential Methods in Regression and Correlation41 Questions
Exam 16: Analysis of Variance Anova71 Questions
Select questions type
A graphical display of a data set is given. State whether the distribution is (roughly)symmetric, right skewed, or leftskewed.
-A stem-and-leaf diagram is given below for the ages of the patients at a hospital. 0 40 1 142 2 0203 3 015829 4 34517182 5 3626893306363 6 628183362690503675 7 25378953678489367855 8 4608532627890 9 14673
Free
(Multiple Choice)
4.9/5  (32)
(32)
Correct Answer: Verified
C
Anna set up a frequency distribution with the following classes: Number of sick days taken Frequency 0-3 3-6 6-9 9-12 What is wrong with these classes? Describe two ways the classes could have been correctly depicted.
Free
(Essay)
4.9/5 (44)
Correct Answer:Verified
Answers will vary. Possible answer: In a frequency distribution, each observation must belong to one and only one class. In Anna's table, there is overlap of the classes - it is not clear, for example, to which class the value 3 belongs. The classes could have been depicted in either of the following ways:
A television manufacturer sold three times as many televisions in 1995 as it did in 1985. To illustrate this fact, the manufacturer draws a pictogram as shown below. The television on the right is three times as tall and three times as wide as the television on the left. 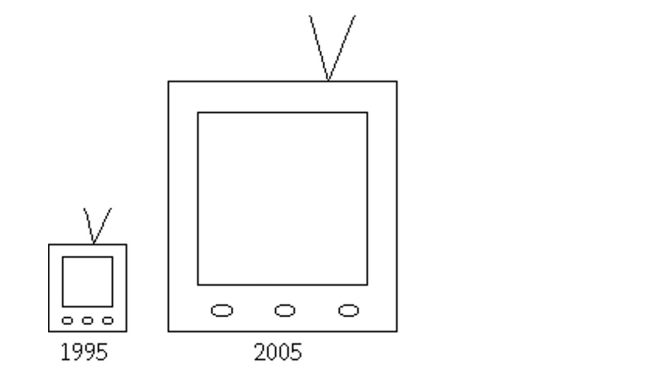 This pictogram is misleading because it actually gives the visual impression that nine times as many televisions were sold in 2005 as in 1995. How can the manufacturer correctly illustrate the fact that sales in 2005 were three times sales in 1995?
Free
(Essay)
4.8/5 (40)
Correct Answer:Verified
Answers will vary. Possible answer: The television on the right should have three times the area of the television on the left. This does not mean that its dimensions will be three times as big. (In fact, its dimensions will be times the dimensions of the television on the left).
Construct a bar graph for the relative frequencies given. Blood type Frequency Relative frequency 22 0.44 19 0.38 6 0.12 3 0.06
(Multiple Choice)
4.9/5 (40)
Use single-value grouping to organize these data into a frequency distribution.
-A car insurance company conducted a survey to find out how many car accidents people had been involved in. They selected a sample of 32 adults between the ages of 30 and 70 and asked each
Person how many accidents they had been involved in the past ten years. The following data were
Obtained.
0 1 0 3 2 1 0 2 1 1 1 0 2 0 4 1 2 0 0 1 0 2 1 3 1 3 0 0 1 0 5 4
(Multiple Choice)
4.7/5 (37)
The number of cars passing a busy intersection between 4:30 P.M. and 6:30 P.M. on a Monday is 2,200.
(Multiple Choice)
4.8/5 (23)
Provide an appropriate response.
-Suppose that a group of professional athletes consists of 100 gymnasts and 100 basketball players. What kind of distribution do you think the heights of the athletes would have? Explain your thinking.
(Essay)
4.8/5 (31)
The following table gives the top five movies at the box office this week. Rank Last week Movie title Studio Box office sales (\ millions) 1 N/A Pirate Adventure Movie Giant 35.2 2 2 Secret Agent Files G.M.G. 19.5 3 1 Epic Super Hero Team 21st Century 14.3 4 5 Reptile Ride Movie Giant 10.1 5 4 Must Love Cats Dreamboat 9.9 What kind of data is provided by the information in the fourth column?
(Multiple Choice)
4.9/5 (38)
Complete the contingency table and use it to solve the problem.
-The partially filled contingency table gives the relative frequencies of the data on age (in years)and sex from the residents of a retirement home. 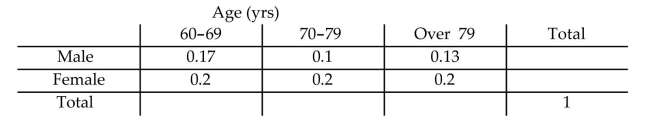 What percentage of residents are females in the age group 70-79?
(Multiple Choice)
4.8/5 (39)
A television manufacturer sold three times as many televisions in 2005 as it did in 1995. To illustrate this fact, the manufacturer draws a pictogram as shown below. The television on the right is three times as tall and three times as wide as the television on the left. 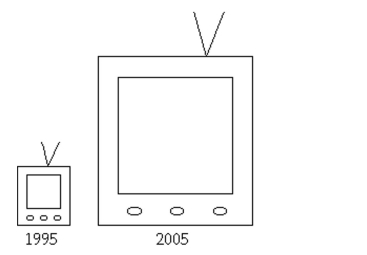 Why is this pictogram misleading? What visual impression is portrayed by the pictogram?
(Essay)
4.7/5 (41)
What type of data is provided by the statement "Helen finished in 8th place in the ice dancing competition"?
(Multiple Choice)
4.8/5 (34)
Construct the requested histogram.
-During the quality control process at a manufacturing plant, 142 finished items are randomly selected and weighed. The results are summarized in the table below. Construct a relative-frequency histogram corresponding to data below. Weight () Frequency Relative frequency 0.35 -under 0.45 32 0.225 0.45 -under 0.55 82 0.577 0.55 -under 0.65 17 0.120 0.65 -under 0.75 11 0.077 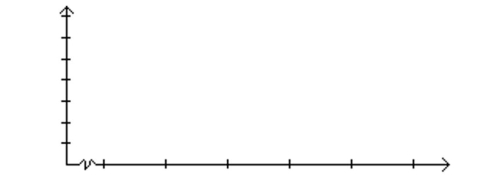
(Essay)
4.9/5 (38)
Construct a pie chart representing the given data set.
-The following data give the distribution of the types of houses in a town containing 26,000 houses. House Type Frequency Relative Frequency Cape 6500 0.25 Garrison 10,400 0.35 Split 9100 0.40
(Multiple Choice)
4.8/5 (31)
A graphical display of a data set is given. Identify the overall shape of the distribution as (roughly)bell-shaped,triangular, uniform, reverse J-shaped, J-shaped, right skewed, left skewed, bimodal, or multimodal.
-A stem-and-leaf diagram is given below for the ages of the patients at a hospital.
0 40 1 42 2 0203 3 015829 4 34517182 5 3626893306363 6 628183362690503675 7 25378953678489367855 8 4608532627890 9 14673
(Multiple Choice)
4.7/5 (29)
The results of a survey about a recent judicial appointment are given in the table below. Construct a relative frequency distribution. Response Frequency Strongly Favor 24 Favor 39 Neutral 9 Oppose 14 Strongly Oppose 114
(Essay)
4.8/5 (42)
The following table shows the heights of the five tallest mountains in North America. Mountain Height (ft) Rank McKinley 20,320 1 Logan 19,850 2 Citlaltepec 18,700 3 St. Elias 18,008 4 Popocatepetl 17,930 5 What kind of data is given in the second column of the table?
(Multiple Choice)
4.9/5 (40)
Construct a relative-frequency polygon for the given data.
-The table contains the frequency and relative-frequency distributions for the ages of the employees in a particular company department. Age (years) Frequency Relative frequency 20 -under 30 6 0.375 30 -under 40 3 0.1875 40 -under 50 4 0.25 50 -under 60 2 0.125 60 -under 70 1 0.0625 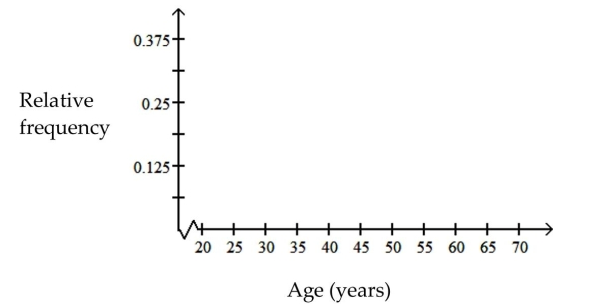
(Essay)
4.8/5 (37)
Provide an appropriate response.
-A parcel delivery service lowered its prices and finds that it has delivered twice as many parcels this year as it did last year. To illustrate this fact, the manager draws a pictogram as shown below. Each cube depicts a parcel. The side length of the "parcel" on the right is twice the side length of the "parcel" on the left. 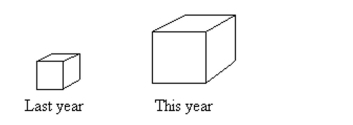 Why is this pictogram misleading? What visual impression is portrayed by the pictogram?
(Essay)
4.8/5 (34)
Complete the contingency table and use it to solve the problem.
-The partially filled contingency table gives the frequencies of the data on age (in years)and sex from the residents of a retirement home. 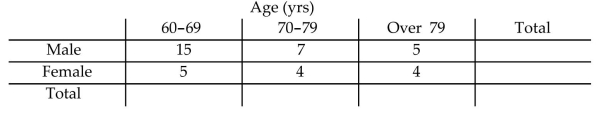 What is the relative frequency for males ?
(Multiple Choice)
4.9/5 (36)
Construct a pie chart representing the given data set.
-The data below represent the results of a poll in which the the following question was asked: "To what degree are you satisfied with the outcome of the 2006 mayoral election?
Very
Somewhat
Not at All
No opinion
(Multiple Choice)
4.8/5 (34)
Filters
- Essay(0)
- Multiple Choice(0)
- Short Answer(0)
- True False(0)
- Matching(0)