Exam 7: The Sampling Distribution of the Sample Mean
Exam 1: The Nature of Statistics88 Questions
Exam 2: Organizing Data169 Questions
Exam 3: Descriptive Measures195 Questions
Exam 4: Probability Concepts133 Questions
Exam 5: Discrete Random Variables163 Questions
Exam 6: The Normal Distribution144 Questions
Exam 7: The Sampling Distribution of the Sample Mean76 Questions
Exam 8: Confidence Intervals for One Population Mean84 Questions
Exam 9: Hypothesis Tests for One Population Mean58 Questions
Exam 10: Inferences for Two Population Means103 Questions
Exam 11: Inferences for Population Standard Deviations101 Questions
Exam 12: Inferences for Population Proportions104 Questions
Exam 13: Chi-Square Procedures74 Questions
Exam 14: Descriptive Methods in Regression and Correlation55 Questions
Exam 15: Inferential Methods in Regression and Correlation41 Questions
Exam 16: Analysis of Variance Anova71 Questions
Select questions type
The ages of six members of a board of directors of a nonprofit organization are shown below.
Member A B C D E F Age 32 52 43 64 41 50
Consider these board members to be a population of interest. The mean age, , for the population is 47. Construct a table that shows all of the possible samples of size two. For each of the possible samples, list the people in the sample, their ages, and the sample mean. The first line of the table is shown below.
Sample Ages , 32,52 42
Use your table to find the probability that, for a random sample of size two, the sample mean will equal the population mean.
Free
(Essay)
4.9/5  (35)
(35)
Correct Answer: Verified
Probability that sample mean equals population mean = 0.
Find the indicated probability or percentage for the sampling error.
-The distribution of weekly salaries at a large company is reverse J-shaped with a mean of $1000 and a standard deviation of $370. What is the probability that the sampling error made in Estimating the mean weekly salary for all employees of the company by the mean of a random Sample of weekly salaries of 80 employees will be at most $75?
Free
(Multiple Choice)
4.8/5 (36)
Correct Answer:Verified
C
Find the indicated probability or percentage for the sampling error.
-Scores on an aptitude test are distributed with a mean of 220 and a standard deviation of 30. The shape of the distribution is unspecified. What is the probability that the sampling error made in
Estimating the population mean by the mean of a random sample of 50 test scores will be at most 5 points?
Free
(Multiple Choice)
4.8/5 (33)
Correct Answer:Verified
C
Provide an appropriate response.
-The mean height for a population is 65 inches and the standard deviation is 3 inches. Let A and B
denote the events described below.
Event A: The height of a randomly selected person is 5 inches or more from the population mean.
Event B: The mean height in a random sample of 16 people is 5 inches or more from the population
mean.
The probability of event A is greater than the probability of event B?
(True/False)
5.0/5 (43)
For the population of one town, the number of siblings is a random variable whose relative frequency histogram has a reverse J-shape. Let denote the mean number of siblings for a random sample of size 3 . For samples of size 3 , which of the following statements concerning the sampling distribution of the mean is true?
(Multiple Choice)
4.8/5 (35)
Provide an appropriate response.
-The mean height for a population is 65 inches and the standard deviation is 3 inches. Let A and B
denote the events described below.
Event A: The height of a randomly selected person is within 3 inches of the population mean.
Event B: The mean height in a random sample of 16 people is within 3 inches of the population
mean.
The probability of event A is greater than the probability of event B?
(True/False)
4.8/5 (28)
Provide an appropriate response.
-What generally happens to the sampling error as the sample size is decreased?
(Multiple Choice)
4.8/5 (42)
Provide an appropriate response.
-The mean height for a population is 65 inches. Let denote the mean height for a sample of people picked randomly from the population. The standard deviation of for samples of size 30 is smaller than the standard deviation, , of the population?
(True/False)
4.7/5 (33)
Find the requested probability.
-The test scores of 5 students are under consideration. The following is the dotplot for the sampling distribution of the sample mean for samples of size 2. 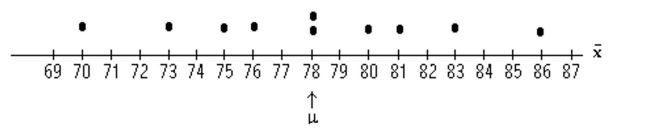 Find the probability, expressed as a percent, that the sample mean will be within 3 points of the
Population mean.
Find the probability, expressed as a percent, that the sample mean will be within 3 points of the
Population mean.
(Multiple Choice)
4.9/5 (38)
Solve the problem.
-The ages of six members on a board of directors of a nonprofit organization are shown
below. Member A B C D E F Age 42 60 68 62 66 43
Consider these board members to be a population of interest. The table below shows all of the possible samples of size two. For each sample, the people in the sample, their ages, and the sample mean are listed. Use the table to find the mean of the variable .
Sample Ages A, B 42,60 51 A, C 42,68 55 A, D 42,62 52 A, E 42,66 54 A, F 42,43 42.5 B, C 60,68 64 B, D 60,62 61 B, E 60,66 63 B, F 60,43 51.5 C, D 68,62 65 C, E 68,66 67 C, F 68,43 55.5 D, E 62,66 64 D, F 62,43 52.5 E, F 66,43 54.5
(Short Answer)
4.8/5 (27)
The ages of six members of a board of directors of a nonprofit organization are shown below. Member A B C D E F Age 32 52 43 64 41 50 Consider these board members to be a population of interest. The mean age, µ, for the population is 47. Construct a table that shows all of the possible samples of size four. For each of the possible samples, list the people in the sample, their ages, and the sample mean. The first line of the table is shown below. Sample Ages A, B, C, D 32,52,43,64 47.75 Use your table to find the probability that, for a random sample of size four, the sample mean will be within 4 years of the population mean.
(Essay)
4.9/5 (34)
Population data: 3, 4, 5, 6, 7. a. Find the mean, , of the variable. b. Use the population data below to construct a table giving the sample means of sample size . c. Draw a dotplot for the sampling distribution of the sample mean. d. Find the probability that the sample mean will equal the population mean. e. Find the probability that the sampling error made in estimating the population mean by the sampling mean will be or less (in magnitude), that is, that the absolute value of the difference between the sample mean and the population mean is at most .
(Essay)
4.9/5 (39)
Provide an appropriate response.
-The mean height for a population is 65 inches and the standard deviation is 3 inches. Let denote the mean height for a sample of people picked randomly from the population. The standard deviation of for samples of size 30 is greater than the standard deviation of for samples of size 20?
(True/False)
4.9/5 (37)
Identify the distribution of the sample mean. In particular, state whether the distribution of is normal or approximatelynormal and give its mean and standard deviation.
-The weights of people in a certain population are normally distributed with a mean of 152 lb and a standard deviation of 22 lb. Determine the sampling distribution of the mean for samples of size 2.
(Multiple Choice)
4.8/5 (36)
Provide an appropriate response.
-A population of people has a mean height of 65 inches. Andrew picks a person at random from the population and records his or her height. He repeats this procedure 49 times more. Bob picks a sample of 30 people at random from the population and records the mean height of the sample. He repeats this procedure 49 times more. Which set of numbers (those recorded by Andrew or those recorded by Bob)do you think will have more variability? Explain your reasoning.
(Essay)
4.8/5 (34)
Solve the problem.
-The ages of six members of a board of directors of a nonprofit organization are shown below.
Member A B C D E F Age 32 52 43 64 41 50
Consider these board members to be a population of interest. The mean age, , for the population is 47. Construct a table that shows all of the possible samples of size five. For each of the possible samples, list the people in the sample, their ages, and the sample mean. The first line of the table is shown below. Sample Ages A ,B,C,D,E 32,52,43,64,41 46.4
Use your table to find the probability that, for a random sample of size five, the sample mean will be within 2 years of the population mean.
(Essay)
4.8/5 (31)
For samples of the specified size from the population described, find the mean and standard deviation of the sample .
-The National Weather Service keeps records of snowfall in mountain ranges. Records indicate that in a certain range, the annual snowfall has a mean of 106 inches and a standard deviation of 10
Inches. Suppose the snowfalls are sampled during randomly picked years. For samples of size 25,
Determine the mean and standard deviation of
(Multiple Choice)
4.8/5 (28)
SAT verbal scores are normally distributed with a mean of 430 and a standard deviation of 120 (based on data from the College Board ATP). Consider the following two problems, which appear at a glance to be very similar. Which one requires the application of the Central Limit Theorem, and in what way does the solution process differ between the two problems? (a)If a student is randomly selected, what is the probability that his or her score is above 500? (b)If a sample of 35 students is selected randomly, what is the probability that the sample mean will be above 500?
(Essay)
4.9/5 (39)
Find the indicated probability or percentage for the sampling error.
-Scores on a chemistry final exam are normally distributed with a mean of 280 and a standard deviation of 50. Determine the percentage of samples of size 4 that will have mean scores within 35 Points of the population mean score of 280.
(Multiple Choice)
4.9/5 (31)
Filters
- Essay(0)
- Multiple Choice(0)
- Short Answer(0)
- True False(0)
- Matching(0)