Exam 14: Descriptive Methods in Regression and Correlation
Exam 1: The Nature of Statistics88 Questions
Exam 2: Organizing Data169 Questions
Exam 3: Descriptive Measures195 Questions
Exam 4: Probability Concepts133 Questions
Exam 5: Discrete Random Variables163 Questions
Exam 6: The Normal Distribution144 Questions
Exam 7: The Sampling Distribution of the Sample Mean76 Questions
Exam 8: Confidence Intervals for One Population Mean84 Questions
Exam 9: Hypothesis Tests for One Population Mean58 Questions
Exam 10: Inferences for Two Population Means103 Questions
Exam 11: Inferences for Population Standard Deviations101 Questions
Exam 12: Inferences for Population Proportions104 Questions
Exam 13: Chi-Square Procedures74 Questions
Exam 14: Descriptive Methods in Regression and Correlation55 Questions
Exam 15: Inferential Methods in Regression and Correlation41 Questions
Exam 16: Analysis of Variance Anova71 Questions
Select questions type
Compute the specified sum of squares.
-The regression equation for the data below is .
2 4 5 6 7 11 13 20
SST
Free
(Multiple Choice)
4.8/5  (33)
(33)
Correct Answer: Verified
D
Determine the y-intercept and slope of the linear equation.
-
Free
(Multiple Choice)
4.9/5 (39)
Correct Answer:Verified
B
A set of data points and the equations of two lines are given. For each line, determine . Then, determine which line fits the set of data points better, according to the least-squares criterion.
- 0 1 3 3 5 7 6 5 4 2
Line A:
Line
Free
(Multiple Choice)
4.7/5 (36)
Correct Answer:Verified
C
In the context of regression analysis, the regression sum of squares is the variation in
the observed values of the response variable explained by the regression.
(True/False)
4.9/5 (34)
Determine the y-intercept and slope of the linear equation.
-y = 1
(Multiple Choice)
4.8/5 (38)
Obtain the linear correlation coefficient for the data. Round your answer to three decimal places.
- 57 53 59 61 53 56 60 156 164 163 177 159 175 151
(Multiple Choice)
4.9/5 (31)
A regression equation is obtained for the following set of data. 2 4 6 9 10 12 28 33 39 45 47 52
For what range of x-values would it be reasonable to use the regression equation to predict the y-value corresponding to a given x-value? Why?
(Essay)
4.9/5 (37)
What is the relationship between the linear correlation coefficient and the usefulness of the regression equation for making predictions?
(Essay)
4.8/5 (40)
For a day's work, Chris is paid $50 to cover expenses plus $16 per hour. Let x denote the number of hours Chris works in a day and let y denote Chris's total salary for the day. Obtain the equation that expresses y in terms of x. Construct a table of values using the x-values 2, 4, and 8 hours. Draw the graph of the equation by plotting the points from the table and connecting them with a straight line. Use the graph to estimate visually Chris's salary for the day if he works 6 hours. 
(Essay)
4.8/5 (40)
A ball is thrown downward from a tall building with an initial velocity of 10 meters per second (m/sec). According to the laws of physics, if you let y denote the velocity of the ball after x seconds, y = 10 + 9.8x. Determine b0 and b1 for this linear equation. Determine the velocity of the ball after 1, 2, 3, and 4 seconds. Use these four points to graph the linear equation y = 10 + 9.8x. Use the graph to estimate visually the velocity of the ball after 2.5 seconds. 
(Essay)
4.9/5 (36)
Is the data point, P, an outlier, a potential influential observation, both, or neither?
-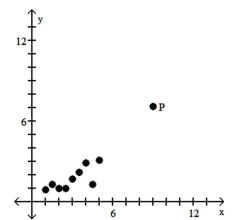
(Multiple Choice)
4.8/5 (27)
The y-intercept and slope, respectively, of a straight line are given. Find the equation of the line.
- and
(Multiple Choice)
4.9/5 (36)
For each of 200 randomly selected cities, Pete compared data for the number of churches in the city (x)and the number of homicides in the past decade (y). He calculated the linear correlation coefficient and was surprised to find a strong positive linear correlation for the two variables. Does this suggest that when a city builds new churches this will tend to cause an increase in the number of homicides? Why do you think that a strong positive linear correlation coefficient was obtained?
(Essay)
4.8/5 (41)
Explain why having a high linear correlation does not imply causality. Give an example to support your answer.
(Essay)
4.8/5 (38)
You are given information about a straight line. Use two points to graph the equation.
-The equation of the line is y = 1 - 0.75x. 
(Multiple Choice)
4.9/5 (33)
You are given information about a straight line. Use two points to graph the equation.
-The equation of the line is .
(Multiple Choice)
4.9/5 (23)
Obtain the linear correlation coefficient for the data. Round your answer to three decimal places.
-Managers rate employees according to job performance (x)and attitude (y). The results for several randomly selected employees are given below. 59 63 65 69 58 77 76 69 70 64 72 67 78 82 75 87 92 83 87 78
(Multiple Choice)
4.9/5 (38)
The paired data below consist of the temperatures on randomly chosen days and the amount a certain kind of plant grew (in millimeters):
62 76 50 51 71 46 51 44 79 36 39 50 13 33 33 17 6 16
Find the SSR.
(Multiple Choice)
4.9/5 (37)
Compute the coefficient of determination. Round your answer to four decimal places.
-For a particular regression analysis, it is found that SST = 913.5 and SSE = 77.9.
(Multiple Choice)
4.8/5 (27)
Obtain the linear correlation coefficient for the data. Round your answer to three decimal places.
-The data below show the cost of advertising (x), in thousands of dollars, and the number of products sold (y), in thousands, for each of eight randomly selected product lines.
9 2 3 4 2 5 9 10 85 52 55 68 67 86 83 73
(Multiple Choice)
4.8/5 (41)
Filters
- Essay(0)
- Multiple Choice(0)
- Short Answer(0)
- True False(0)
- Matching(0)