Exam 15: Inferential Methods in Regression and Correlation
The graph below is a residual plot for a set of regression data. Does the graph suggest violation of one or more of the assumptions for regression inferences? Explain your answer. 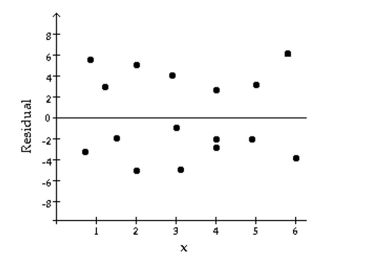
No, the graph does not suggest violation of any of the assumptions for regression inferences. The linearity assumption and the constant-standard-deviation assumption appear to be met. The normality assumption cannot be assessed from the residual plot; a normal probability plot of the residuals would be required to assess the normality assumption.
In the context of regression, explain the difference between a confidence interval for a conditional mean and a prediction interval.
A confidence interval for a conditional mean is an interval estimate of the mean value of the response variable for all individuals with a particular value of the predictor variable. A prediction interval is an interval estimate of the value of the response variable for a single individual with a particular value of the predictor variable.
What would you expect for the linear correlation coefficient between a set of sample data and their normal scores if the variable under consideration is normally distributed. Why?
The correlation coefficient should be near 1 because the normal probability plot should be roughly linear.
In the correlation test for normality, the null hypothesis is rejected if the linear correlation coefficient between the sample data and their normal scores is:
The correlation test for normality involves computing the linear correlation coefficient between which of the following pairs?
A researcher is interested in the relationship between age and income. He performs a regression analysis using age as the predictor variable and annual income as the response variable. He obtains the equation of the regression line and then computes the standard error of the estimate, which comes out to $6570. Give an interpretation of the standard error of the estimate.
Construct a residual plot for the given data.
-A grass seed company conducts a study to determine the relationship between the density of seeds planted (in pounds per 500 sq ft)and the quality of the resulting lawn. Eight similar plots of land are selected and each is planted with a particular density of seed. One month later the quality of each lawn is rated on a scale of 0 to 100. The sample data are given below, where x denotes seed density, and y denotes lawn quality. x 1 1 2 3 3 3 4 5 30 40 40 40 50 65 50 50 
Construct a normal probability plot of the residuals for the given regression data.
-Applicants for a particular job, which involves extensive travel in Spanish speaking countries, must take a proficiency test in Spanish. The sample data below were obtained in a study of the relationship between the numbers of years applicants have studied Spanish (x)and their score on the test (y). x 3 4 4 2 5 3 4 5 3 2 y 57 78 72 58 89 63 73 84 75 48
Construct a normal probability plot of the residuals for the given regression data.
- 0 1 5 3 3 7 5 -4 0 1 ywithhaton top equals7point105minus2point211x
In a study of the relationship between weight and height, a sample regression equation is obtained, in which height is used as the predictor variable. This sample regression equation is then used to Make inferences. Which of the following statements is true?
The graph below is a residual plot for a set of regression data. Does the graph suggest violation of one or more of the assumptions for regression inferences? Explain your answer. 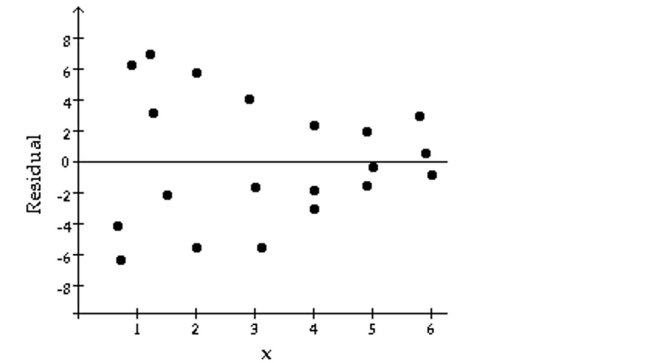
Paired sample data is given. Discuss what it would mean for Assumptions 1-3 for regression inferences to be satisfied bythe variables under consideration.
-A researcher is interested in the relationship between height and foot length for female adults. A random sample of nine women yields the following data, where x denotes height in inches and y denotes foot length in inches. 61 64 60 64 67 65 62 69 62 8.9 9.4 9.0 9.2 10.0 9.7 9.1 10.3 9.5
Perform the required correlation test. You may presume that the assumptions for regression inferences are met.
-A set of sample data consisting of 16 pairs of x and y values yields a sample linear correlation coefficient of -0.371. At the 2.5% significance level, do the data provide sufficient evidence to conclude that x and y are negatively linearly correlated?
Perform the required correlation test. You may presume that the assumptions for regression inferences are met.
-A set of sample data consisting of 23 pairs of x and y values yields a sample linear correlation coefficient of -0.898. At the 1% significance level, do the data provide sufficient evidence to conclude that x and y are linearly correlated?
Construct a residual plot for the given data.
- x 0 1 5 3 3 y 7 5 -4 0 1
Perform the required correlation test. You may presume that the assumptions for regression inferences are met.
-Applicants for a particular job, which involves extensive travel in Spanish speaking countries, must take a proficiency test in Spanish. The sample data below were obtained in a study of the relationship between the numbers of years applicants have studied Spanish (x)and their score on the test (y). 3 4 4 2 5 3 4 5 3 2 57 78 72 58 89 63 73 84 75 48 The sample linear correlation coefficient is r = 0.911. At the 5% significance level, do the data provide sufficient evidence to conclude that number of years of study and test score are positively linearly correlated?
Applicants for a particular job, which involves extensive travel in Spanish speaking countries, must take a proficiency test in Spanish. The sample data below were obtained in a study of the relationship between the numbers of years applicants have studied Spanish (x)and their score on the test (y). 3 4 4 2 5 3 4 5 3 2 57 78 72 58 89 63 73 84 75 48 =31.55+10.90x A 99% confidence interval for the slope of the population regression line that relates test score to number of years of study is 5.05 to 16.75. Provide an interpretation of this confidence interval.
When testing to determine if correlation is significant, we use the hypotheses . . Suppose the conclusion is to reject the null hypothesis. What does that tell us about the linear regression equation?
Decide, at the given significance level, whether the data provide sufficient evidence to conclude that x is useful forpredicting y.
-The sample data below are the index of exposure (x)to radioactive waste for nine different Oregon counties and cancer mortality rate (y)(deaths per 100,000). 2.49 2.57 3.41 1.25 1.62 3.83 11.64 6.41 8.34 147.1 130.1 129.9 113.5 137.5 162.3 207.5 177.9 210.3 =114.72+9.23x The standard error of the estimate is approximately 14.0099. At the 5% level of significance, do the data provide sufficient evidence to conclude that the slope of the population regression line is not 0 and hence that index of exposure is useful as a predictor of cancer mortality rate?
Filters
- Essay(0)
- Multiple Choice(0)
- Short Answer(0)
- True False(0)
- Matching(0)