Exam 11: Inferences for Population Standard Deviations
Exam 1: The Nature of Statistics88 Questions
Exam 2: Organizing Data169 Questions
Exam 3: Descriptive Measures195 Questions
Exam 4: Probability Concepts133 Questions
Exam 5: Discrete Random Variables163 Questions
Exam 6: The Normal Distribution144 Questions
Exam 7: The Sampling Distribution of the Sample Mean76 Questions
Exam 8: Confidence Intervals for One Population Mean84 Questions
Exam 9: Hypothesis Tests for One Population Mean58 Questions
Exam 10: Inferences for Two Population Means103 Questions
Exam 11: Inferences for Population Standard Deviations101 Questions
Exam 12: Inferences for Population Proportions104 Questions
Exam 13: Chi-Square Procedures74 Questions
Exam 14: Descriptive Methods in Regression and Correlation55 Questions
Exam 15: Inferential Methods in Regression and Correlation41 Questions
Exam 16: Analysis of Variance Anova71 Questions
Select questions type
A sample standard deviation and sample size are given. Use the one-standard-deviation x2-test to conduct the requiredhypothesis test.
-
(Multiple Choice)
4.8/5  (42)
(42)
Perform the required hypothesis test for two population standard deviations. Assume that independent samples havebeen randomly selected from the two populations and that the variable under consideration is normally distributed onboth populations. Use the critical-value approach.
-A random sample of 16 women resulted in blood pressure levels with a standard deviation of 21.7 mm Hg. A random sample of 17 men resulted in blood pressure levels with a standard deviation of 19 mm Hg. Do the data provide sufficient evidence to conclude that there is more variation among blood pressure levels for women than among blood pressure levels for men? Use a 0.025 significance level .
(Essay)
5.0/5 (31)
A sample standard deviation and sample size are given. Use the one-standard-deviation -interval procedure to obtain the specified confidence interval.
-s = 4, n = 11 , 95% confidence interval
(Multiple Choice)
4.7/5 (29)
Use the F-table and the reciprocal property of F-curves, if necessary, to find the required F-value(s).
-An F-curve has df = (15, 10). Find the F-value having area 0.05 to its left.
(Multiple Choice)
4.9/5 (31)
Decide whether applying one-standard-deviation chi-square procedures to the given data appears reasonable. Explainyour answer.
-Lifetimes (in hours)for a random sample of 12 batteries are as follows: 57 59 61 64 72 76 80 86 93 95 100 102
(Essay)
4.8/5 (35)
Perform the required hypothesis test for two population standard deviations. Assume that independent samples havebeen randomly selected from the two populations and that the variable under consideration is normally distributed onboth populations. Use the critical-value approach.
-A researcher is interested in comparing the amount of variation in women's scores on a certain test with the amount of variation in men's scores on the same test. Random samples of 11 men and 13 women yielded the following scores: Men: 72,60,52,87,66,74,95,50,81,70,72 Women: 70,78,62,96,75,68,41,74,80,47,73,94,65 Do the data provide sufficient evidence to conclude that there is less variation in men's scores than in women's scores? Perform an F-test at the 5% significance level. (Note:
(Essay)
4.7/5 (35)
A sample standard deviation and sample size are given. Use the one-standard-deviation -test to conduct the requiredhypothesis test.
-
(Multiple Choice)
4.9/5 (36)
Suppose that you are performing a -test for a population standard deviation. Which of the following statements regarding the distribution of the test statistic is true?
(Multiple Choice)
4.9/5 (40)
The sample standard deviations and sample sizes are given for independent simple random samples from twopopulations. Use the two-standard-deviations F-test to conduct the required hypothesis test.
- ; two-tailed test,
(Multiple Choice)
4.8/5 (43)
Use the F-table and the reciprocal property of F-curves, if necessary, to find the required F-value(s).
-An F-curve has df = (24, 3). Find the F-value having area 0.005 to its right.
(Multiple Choice)
4.8/5 (40)
Decide whether applying one-standard-deviation chi-square procedures to the given data appears reasonable. Explainyour answer.
-A machine that fills soda bottles is supposed to fill them to a mean volume of 16.2 fluid ounces. A random sample of 20 filled bottles produced the following volumes in fluid ounces: 16.3 15.9 16.7 15.3 17.1 16.4 3.9 15.9 16.2 3.4 16.4 8.2 15.5 16.5 16.0 16.3 15.8 16.7 16.5 15.5
(Essay)
4.7/5 (37)
Perform the required hypothesis test for two population standard deviations. Assume that independent samples havebeen randomly selected from the two populations and that the variable under consideration is normally distributed onboth populations. Use the critical-value approach.
-A researcher obtained independent random samples of men from two different towns. She recorded the weights of the men. The results are summarized below: =165.1 =159.5 =26.4 =25.6 Do the data provide sufficient evidence to conclude that there is more variation in weights of men from town A than in weights of men from town B? Perform an F-test at the 1% significance level.
(Essay)
4.8/5 (40)
The sample standard deviations and sample sizes are given for independent simple random samples from twopopulations. Use the two-standard-deviations F-interval procedure to obtain the specified confidence interval. Round tothe nearest hundredth.
- confidence interval
(Multiple Choice)
4.8/5 (39)
The sample standard deviations and sample sizes are given for independent simple random samples from twopopulations. Use the two-standard-deviations F-interval procedure to obtain the specified confidence interval. Round tothe nearest hundredth.
- confidence interval
(Multiple Choice)
4.7/5 (32)
Perform the required hypothesis test for two population standard deviations. Assume that independent samples havebeen randomly selected from the two populations and that the variable under consideration is normally distributed onboth populations. Use the critical-value approach.
-Test scores for random samples of students from two different schools were recorded. The summary statistics are given below. 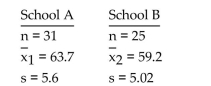 Do the data provide sufficient evidence to conclude that variation in test scores differs between students from school A and students from school B? Use a significance level of 0.10.
(Essay)
4.9/5 (42)
Filters
- Essay(0)
- Multiple Choice(0)
- Short Answer(0)
- True False(0)
- Matching(0)