Exam 18: A Roadmap for Analyzing Data
Exam 1: Defining and Collecting Data200 Questions
Exam 2: Organizing and Visualizing189 Questions
Exam 3: Numerical Descriptive Measures80 Questions
Exam 4: Basic Probability108 Questions
Exam 5: Discrete Probability Distributions81 Questions
Exam 6: Conthe Tinuonormausl Disdis Tributionstribution and Other38 Questions
Exam 7: Sampling Distributions62 Questions
Exam 8: Confidence Interval Estimation139 Questions
Exam 9: Fundamentals of Hypothesis Testing: One-Sample Tests133 Questions
Exam 10: Two-Sample Tests95 Questions
Exam 11: Analysis of Variance73 Questions
Exam 12: Chi-Square and Nonparametric100 Questions
Exam 13: Simple Linear Regression89 Questions
Exam 14: Introduction to Multiple113 Questions
Exam 15: Multiple Regression62 Questions
Exam 16: Time-Series Forecasting61 Questions
Exam 17: Business Analytics102 Questions
Exam 18: A Roadmap for Analyzing Data133 Questions
Exam 19: Statistical Applications in Quality Management86 Questions
Exam 20: Decision Making121 Questions
Select questions type
SCENARIO 18-1
A real estate builder wishes to determine how house size (House)is influenced by family income
(Income), family size (Size), and education of the head of household (School).House size is
measured in hundreds of square feet, income is measured in thousands of dollars, and education is in
years.The builder randomly selected 50 families and ran the multiple regression.Microsoft Excel
output is provided below: 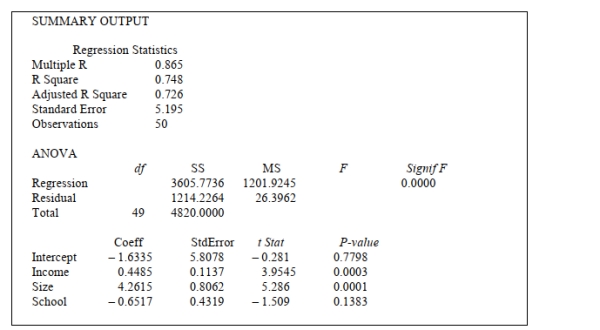 -Referring to Scenario 18-1, the observed value of the F-statistic is missing from the printout.
What are the degrees of freedom for this F-statistic?
-Referring to Scenario 18-1, the observed value of the F-statistic is missing from the printout.
What are the degrees of freedom for this F-statistic?
(Multiple Choice)
4.9/5  (32)
(32)
An entrepreneur is considering the purchase of a coin-operated laundry.The current owner
Claims that over the past 5 years, the mean daily revenue was $675 with a standard deviation of
$75)A sample of 30 days reveals a daily mean revenue of $625 and a standard deviation of $70.
Which of the following tests will be the most appropriate?
(Multiple Choice)
4.8/5 (35)
A quality control engineer is in charge of the manufacture of computer disks.Two different
Processes can be used to manufacture the disks.He suspects that the Kohler method produces a
Greater proportion of defects than the Russell method.He samples 150 of the Kohler and 200 of
The Russell disks and finds that 27 and 18 of them, respectively, are defective.If Kohler is
Designated as "Group 1" and Russell is designated as "Group 2," which of the following tests
Will you use to find out if the Kohler method is worse than the Russell method?
(Multiple Choice)
4.9/5 (33)
SCENARIO 18-2 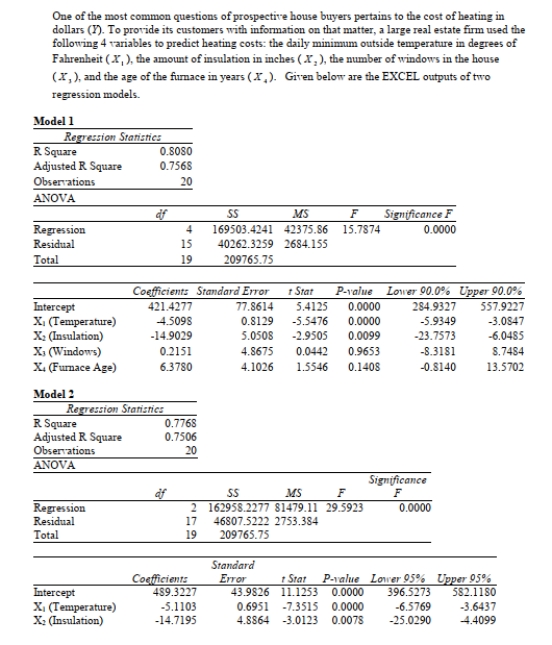 -Referring to Scenario 18-2, what is the value of the partial F test statistic for
(Multiple Choice)
4.7/5 (39)
A sample of 100 fuses from a very large shipment is found to have 10 that are defective.Based
On this information, which of the following will you construct to learn about the proportion of
Fuses that are defective?
(Multiple Choice)
4.9/5 (41)
A physician and president of a Tampa Health Maintenance Organization (HMO)are attempting
To show the benefits of managed health care to an insurance company.The physician believes
That certain types of doctors are more cost-effective than others.To investigate this, the president
Obtained independent random samples of 20 HMO physicians from each of 4 primary specialties
- General Practice (GP), Internal Medicine (IM), Pediatrics (PED), and Family Physicians (FP)-
And recorded the total charges per member per month for each.A second variable which the
President believes influences total charges per member per month is whether the doctor is a
Foreign or USA medical school graduate.To investigate this, the president also collected data on
20 foreign medical school graduates in each of the 4 primary specialty types described above.So
Information on charges for 40 doctors (20 foreign and 20 USA medical school graduates)was obtained for each of the 4 specialties.The president has already found out that specialty types
And origin of the medical degree do not interact to affect the charges.Which of the following
Tests will be the most appropriate to find out if the primary specialty affects the charges?
(Multiple Choice)
4.8/5 (35)
SCENARIO 18-3 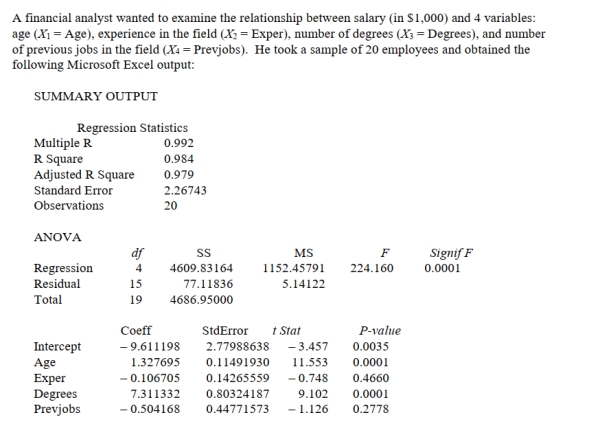 -Referring to Scenario 18-3, the net regression coefficient of X2 is ________.
(Essay)
4.9/5 (35)
SCENARIO 18-9
What are the factors that determine the acceleration time (in sec.)from 0 to 60 miles per hour of a
car? Data on the following variables for 171 different vehicle models were collected:
Accel Time: Acceleration time in sec.
Cargo Vol: Cargo volume in cu.ft.
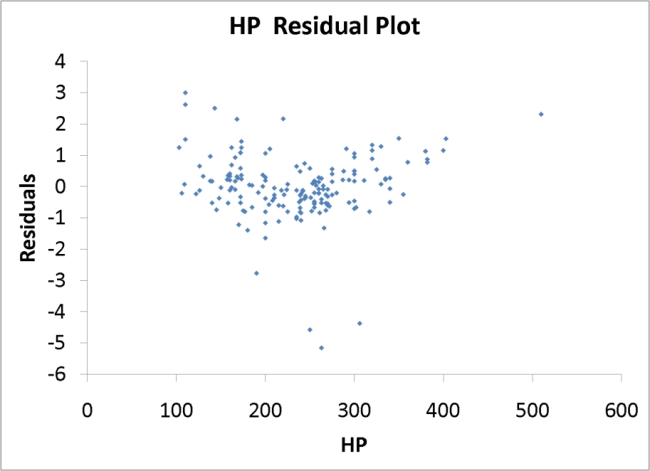
HP: Horsepower
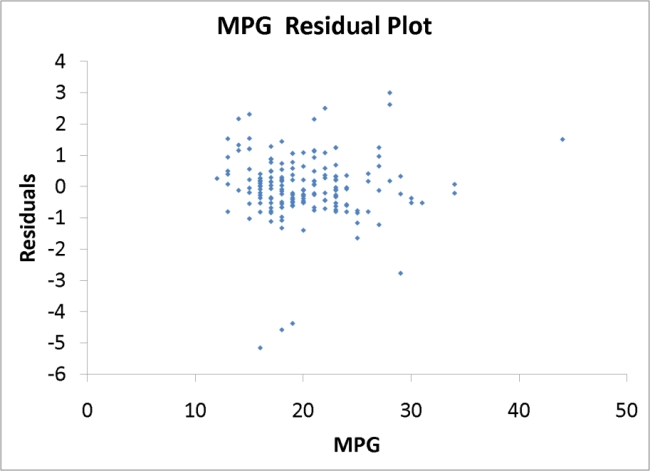
MPG: Miles per gallon
SUV: 1 if the vehicle model is an SUV with Coupe as the base when SUV and Sedan are both 0
Sedan: 1 if the vehicle model is a sedan with Coupe as the base when SUV and Sedan are both 0
The regression results using acceleration time as the dependent variable and the remaining variables
as the independent variables are presented below. 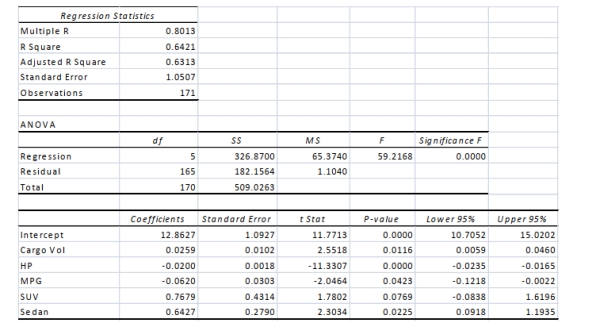 The various residual plots are as shown below.
 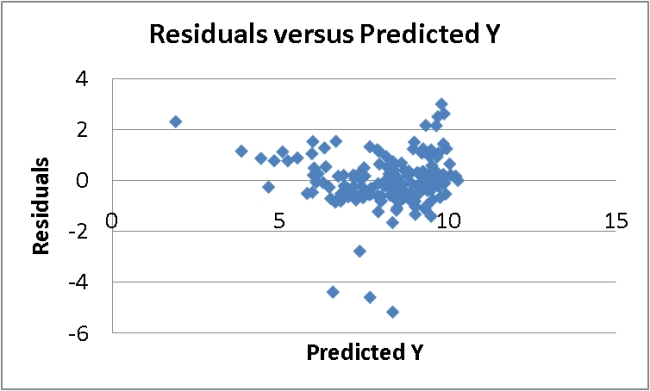 A Roadmap for Analyzing Data 18-63
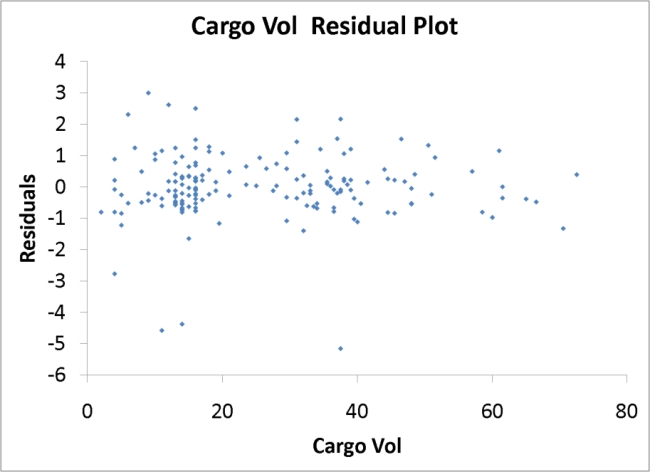
 18-64 A Roadmap for Analyzing Data
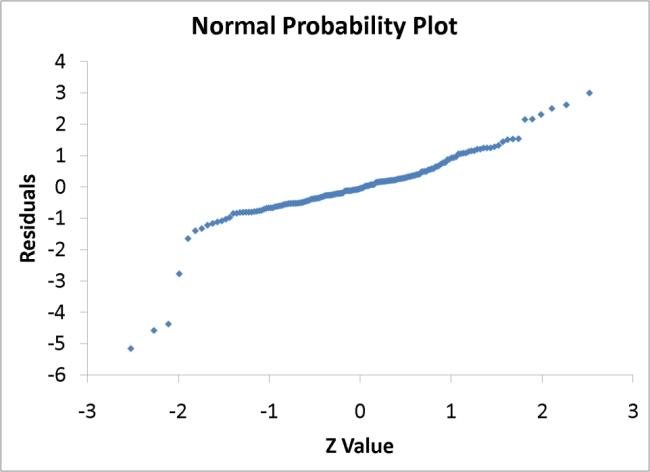
 -True or False: Referring to Scenario 18-9, the 0 to 60 miles per hour acceleration time of a
sedan is predicted to be 0.7679 seconds higher than that of an SUV.
-True or False: Referring to Scenario 18-9, the 0 to 60 miles per hour acceleration time of a
sedan is predicted to be 0.7679 seconds higher than that of an SUV.
(True/False)
4.8/5 (32)
Every spring semester, the School of Business coordinates with local business leaders a luncheon
For graduating seniors, their families, and friends.Corporate sponsorship pays for the lunches of
Each of the seniors, but students have to purchase tickets to cover the cost of lunches served to
Guests they bring with them.Data on the number of guests each graduating senior invited to the
Luncheon and the number of graduating seniors in each category were collected.You want to
Know the most popular number of guests brought by the graduating seniors.Which of the
Following will you compute?
(Multiple Choice)
4.9/5 (25)
SCENARIO 18-1
A real estate builder wishes to determine how house size (House)is influenced by family income
(Income), family size (Size), and education of the head of household (School).House size is
measured in hundreds of square feet, income is measured in thousands of dollars, and education is in
years.The builder randomly selected 50 families and ran the multiple regression.Microsoft Excel
output is provided below:
-Referring to Scenario 18-1, what fraction of the variability in house size is explained by income,
Size of family, and education?
(Multiple Choice)
5.0/5 (24)
SCENARIO 18-1
A real estate builder wishes to determine how house size (House)is influenced by family income
(Income), family size (Size), and education of the head of household (School).House size is
measured in hundreds of square feet, income is measured in thousands of dollars, and education is in
years.The builder randomly selected 50 families and ran the multiple regression.Microsoft Excel
output is provided below:
-Referring to Scenario 18-1, one individual in the sample had an annual income of $100,000, a
Family size of 10, and an education of 16 years.This individual owned a home with an area of
7,000 square feet (House = 70.00).What is the residual (in hundreds of square feet)for this data
Point?
(Multiple Choice)
4.8/5 (41)
The superintendent of a school district wanted to predict the percentage of students passing a
Sixth-grade proficiency test.She obtained the data on percentage of students passing the
Proficiency test (% Passing), daily mean of the percentage of students attending class (%
Attendance), mean teacher salary in dollars (Salaries), and instructional spending per pupil in
Dollars (Spending)of 47 schools in the state.She believed that holding everything else constant,
Instructional spending per pupil had a positive but decreasing impact on percentage.Which of
The following would be the most appropriate analysis to perform?
(Multiple Choice)
4.9/5 (33)
SCENARIO 18-1
A real estate builder wishes to determine how house size (House)is influenced by family income
(Income), family size (Size), and education of the head of household (School).House size is
measured in hundreds of square feet, income is measured in thousands of dollars, and education is in
years.The builder randomly selected 50 families and ran the multiple regression.Microsoft Excel
output is provided below:
-Referring to Scenario 18-1, what are the regression degrees of freedom that are missing from the
Output?
(Multiple Choice)
4.8/5 (34)
An airline wants to select a computer software package for its reservation system.Four software
Packages (1, 2, 3, and 4)are commercially available.An experiment is set up in which each
Package is used to make reservations for 5 randomly selected weeks and data on the number of
Passengers that are bumped over a month are collected.(A total of 20 weeks was included in the
Experiment.)The variance on the number of passengers that are bumped is found to be roughly
The same for the 4 packages.Which of the following tests will be the most appropriate to find
Out if the mean number of passengers being bumped over a month is the same across the 4
Packages?
(Multiple Choice)
4.9/5 (30)
A sample of 200 students at a Big-Ten university was taken after the midterm to ask whether they
went bar hopping the weekend before the midterm or spent the weekend studying, and whether
they did well or poorly on the midterm.You can use a contingency table to present this
information.
(True/False)
4.8/5 (37)
An agronomist wants to compare the crop yield of 3 varieties of chickpea seeds.She plants all 3
Varieties of the seeds on each of 5 different patches of fields.She then measures the crop yield in
Bushels per acre.Which of the following tests will be the most appropriate to find out if there is
Any difference in crop yield among the 3 varieties?
(Multiple Choice)
5.0/5 (35)
A realtor wants to compare the variability of sales-to-appraisal ratios of residential properties
Sold in four neighborhoods (A, B, C, and D).Four properties are randomly selected from each
Neighborhood and the ratios recorded for each were collected.Which of the following tests will
Be the most appropriate?
(Multiple Choice)
4.9/5 (38)
SCENARIO 18-9
What are the factors that determine the acceleration time (in sec.)from 0 to 60 miles per hour of a
car? Data on the following variables for 171 different vehicle models were collected:
Accel Time: Acceleration time in sec.
Cargo Vol: Cargo volume in cu.ft.
HP: Horsepower
MPG: Miles per gallon
SUV: 1 if the vehicle model is an SUV with Coupe as the base when SUV and Sedan are both 0
Sedan: 1 if the vehicle model is a sedan with Coupe as the base when SUV and Sedan are both 0
The regression results using acceleration time as the dependent variable and the remaining variables
as the independent variables are presented below. The various residual plots are as shown below.
A Roadmap for Analyzing Data 18-63
18-64 A Roadmap for Analyzing Data
-Referring to Scenario 18-9, what is the correct interpretation for the estimated coefficient for
Cargo Vol?
(Multiple Choice)
4.8/5 (38)
An airline wants to select a computer software package for its reservation system.Four software
Packages (1, 2, 3, and 4)are commercially available.The airline will choose the package that
Bumps as few passengers, on the average, as possible during a month.An experiment is set up in
Which each package is used to make reservations for 5 randomly selected weeks.(A total of 20
Weeks was included in the experiment.)Which of the following tests will be the most
Appropriate?
(Multiple Choice)
4.8/5 (35)
Filters
- Essay(0)
- Multiple Choice(0)
- Short Answer(0)
- True False(0)
- Matching(0)