Exam 18: A Roadmap for Analyzing Data
Exam 1: Defining and Collecting Data200 Questions
Exam 2: Organizing and Visualizing189 Questions
Exam 3: Numerical Descriptive Measures80 Questions
Exam 4: Basic Probability108 Questions
Exam 5: Discrete Probability Distributions81 Questions
Exam 6: Conthe Tinuonormausl Disdis Tributionstribution and Other38 Questions
Exam 7: Sampling Distributions62 Questions
Exam 8: Confidence Interval Estimation139 Questions
Exam 9: Fundamentals of Hypothesis Testing: One-Sample Tests133 Questions
Exam 10: Two-Sample Tests95 Questions
Exam 11: Analysis of Variance73 Questions
Exam 12: Chi-Square and Nonparametric100 Questions
Exam 13: Simple Linear Regression89 Questions
Exam 14: Introduction to Multiple113 Questions
Exam 15: Multiple Regression62 Questions
Exam 16: Time-Series Forecasting61 Questions
Exam 17: Business Analytics102 Questions
Exam 18: A Roadmap for Analyzing Data133 Questions
Exam 19: Statistical Applications in Quality Management86 Questions
Exam 20: Decision Making121 Questions
Select questions type
Are Japanese managers more motivated than American managers? A randomly selected group of
100 managers from each group were administered the Sarnoff Survey of Attitudes Toward Life
(SSATL), which measures motivation for upward mobility.The mean and standard deviation of
The SSATL scores are computed.The standard deviations of the SSATL scores suggest that the
Standard deviation from the two groups is very different.Which of the following tests will be the
Most appropriate?
(Multiple Choice)
4.7/5  (36)
(36)
Four surgical procedures currently are used to install pacemakers.If the patient does not need to
Return for follow-up surgery, the operation is called a "clear" operation.A heart center wants to
Compare the 4 procedures, and collects the following numbers of patients from their own records: 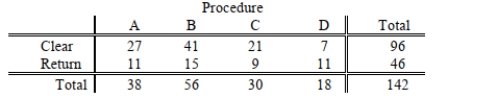 Which of the following tests will be the most appropriate to find out which of the 4 procedures is
The most effective?
Which of the following tests will be the most appropriate to find out which of the 4 procedures is
The most effective?
(Multiple Choice)
4.7/5 (36)
An economist is interested to see how consumption for an economy (in $ billions)is influenced
By gross domestic product ($ billions)and aggregate price (consumer price index).Annual data
From 30 years were collected.Which of the following would be the most appropriate analysis to
Perform?
(Multiple Choice)
4.9/5 (32)
Suppose that past history shows that 60% of college students prefer Coca-Cola.A sample of 10
Students is to be selected.Which of the following distributions would you use to figure out the
Probability that at least half of them will prefer Coca-Cola?
(Multiple Choice)
4.9/5 (34)
The weight of a randomly selected cookie from a production line can most likely be modeled by
Which of the following distributions?
(Multiple Choice)
4.8/5 (41)
True or False: At a meeting of information systems officers for regional offices of a national
company, a survey was taken to determine the number of employees the officers supervise in the
operation of their departments, where X is the number of employees overseen by each
information systems officer.A stem-and-leaf display can be used to present this information.
(True/False)
4.9/5 (28)
To test the effectiveness of a business school preparation course, 8 students took a general
Business test before and after the course.Suppose the before and after exam scores are both
Normally distributed.Which of the following tests will be the most appropriate?
(Multiple Choice)
4.9/5 (33)
SCENARIO 18-6 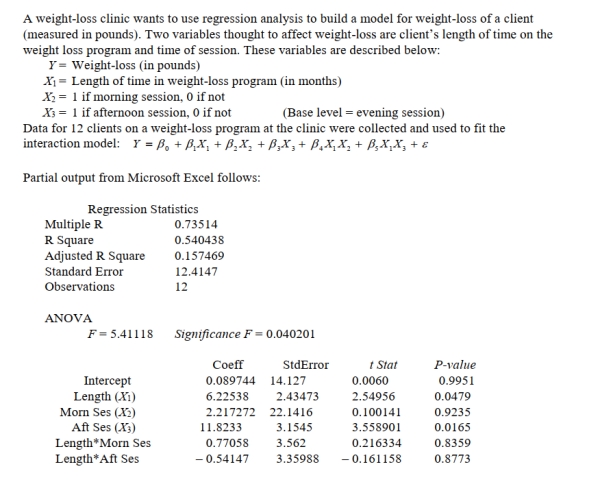 -Referring to Scenario 18-6, in terms of the
  s in the model, give the mean change in weight-
Loss (Y)for every 1 month increase in time in the program
s in the model, give the mean change in weight-
Loss (Y)for every 1 month increase in time in the program  When attending the afternoon
Session.
When attending the afternoon
Session. 
(Multiple Choice)
4.8/5 (37)
SCENARIO 18-2 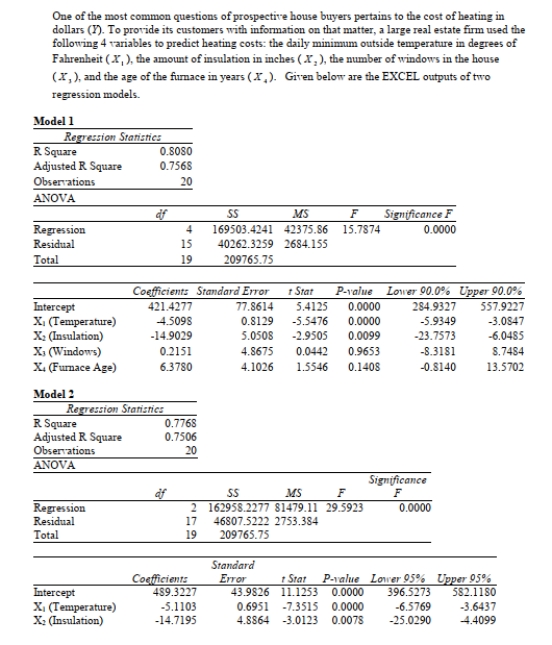 -Referring to Scenario 18-2, what can we say about Model 1?
(Multiple Choice)
5.0/5 (34)
Every spring semester, the School of Business coordinates with local business leaders a luncheon
For graduating seniors, their families, and friends.Corporate sponsorship pays for the lunches of
Each of the seniors, but students have to purchase tickets to cover the cost of lunches served to
Guests they bring with them.Data on the number of guests each graduating senior invited to the
Luncheon from 500 graduating seniors last year were collected.Based on this information, which
Of the following will you construct to learn about the percentage of seniors who will bring at
Least one guest to a luncheon?
(Multiple Choice)
4.8/5 (30)
SCENARIO 18-2
-Referring to Scenario 18-2, the estimated value of the partial regression parameter  in Model
1 means that
in Model
1 means that
(Multiple Choice)
5.0/5 (43)
SCENARIO 18-4
You decide to predict gasoline prices in different cities and towns in the United States for your term
project.Your dependent variable is price of gasoline per gallon and your explanatory variables are
per capita income, the number of firms that manufacture automobile parts in and around the city, the
number of new business starts in the last year, population density of the city, percentage of local
taxes on gasoline, and the number of people using public transportation.You collected data of 32
cities and obtained a regression sum of squares SSR= 122.8821.Your computed value of standard
error of the estimate is 1.9549.
-Referring to Scenario 18-4, what is the value of the coefficient of multiple determination?
(Multiple Choice)
4.7/5 (37)
Suppose the light bulbs in a factory burn out at a rate of 50 bulbs per month.Which of the
Following distributions would you use to determine the probability that the next two light bulbs
Will burn out 2 days apart?
(Multiple Choice)
4.8/5 (41)
SCENARIO 18-9
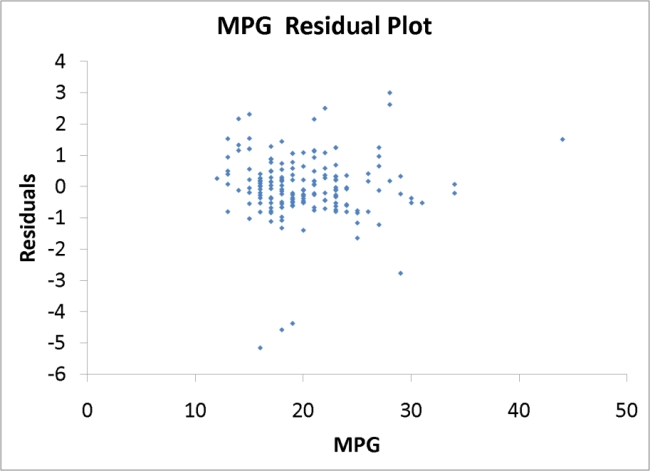
What are the factors that determine the acceleration time (in sec.)from 0 to 60 miles per hour of a
car? Data on the following variables for 171 different vehicle models were collected:
Accel Time: Acceleration time in sec.
Cargo Vol: Cargo volume in cu.ft.
HP: Horsepower
MPG: Miles per gallon
SUV: 1 if the vehicle model is an SUV with Coupe as the base when SUV and Sedan are both 0
Sedan: 1 if the vehicle model is a sedan with Coupe as the base when SUV and Sedan are both 0
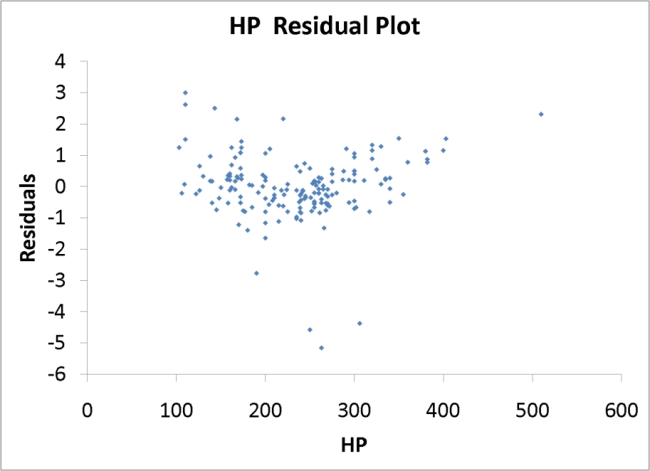
The regression results using acceleration time as the dependent variable and the remaining variables
as the independent variables are presented below. 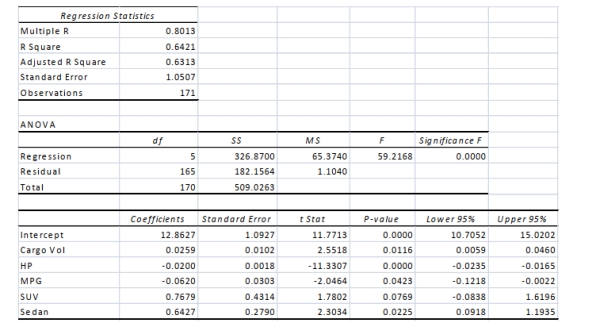 The various residual plots are as shown below.
 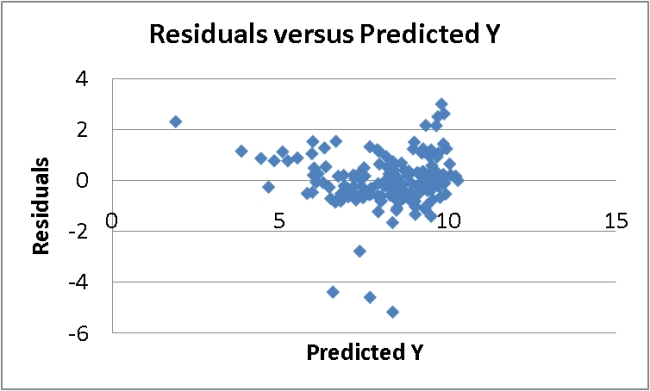 A Roadmap for Analyzing Data 18-63
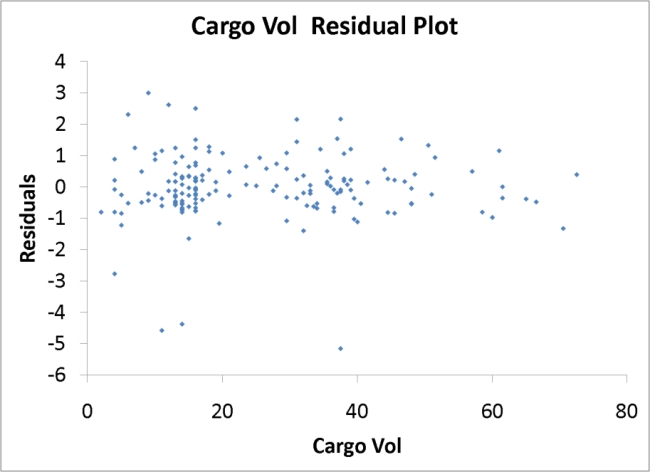
 18-64 A Roadmap for Analyzing Data
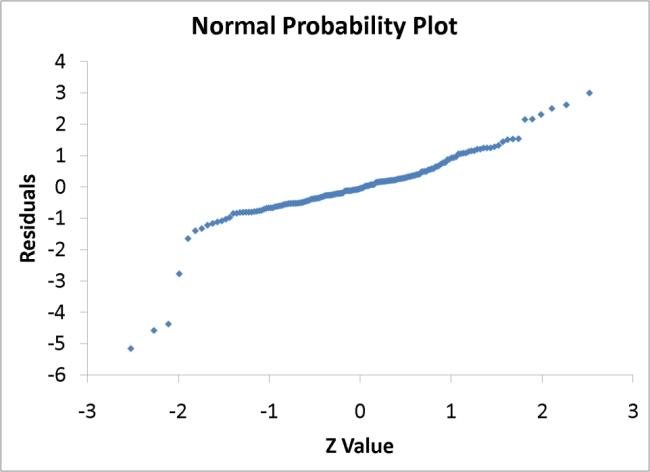
 -True or False: Referring to Scenario 18-9, the 0 to 60 miles per hour acceleration time of an
SUV is predicted to be 0.1252 seconds higher than that of a sedan.
-True or False: Referring to Scenario 18-9, the 0 to 60 miles per hour acceleration time of an
SUV is predicted to be 0.1252 seconds higher than that of a sedan.
(True/False)
4.7/5 (36)
SCENARIO 18-6
-Referring to Scenario 18-6, which of the following statements is supported by the analysis
Shown? 
(Multiple Choice)
4.8/5 (28)
An agronomist wants to compare the crop yield of 3 varieties of chickpea seeds.She plants all 3
Varieties of the seeds on each of 5 different patches of fields.She then measures the crop yield in
Bushels per acre.Which of the following tests will be the most appropriate to find out if the
Different patches is advantageous in reducing the random error?
(Multiple Choice)
4.8/5 (29)
Data on the amount of money made in a year by 1,000 families in a small town were collected.
You want to know if the money made is normally distributed.Which of the following would you
Use?
(Multiple Choice)
4.9/5 (40)
SCENARIO 18-3 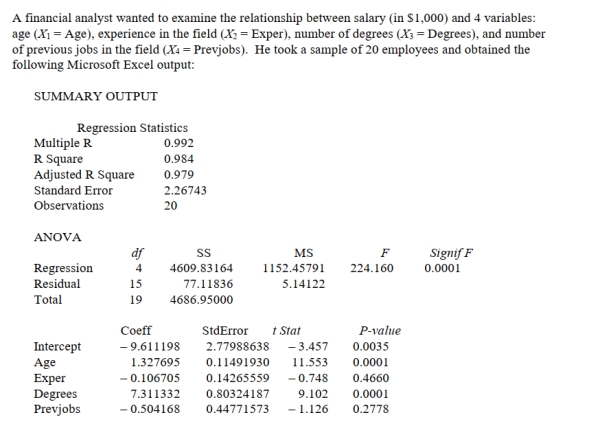 -Referring to Scenario 18-3, the estimate of the unit change in the mean of Y per unit change in
  , taking into account the effects of the other 3 variables, is ________.
(Essay)
4.8/5 (42)
The Tampa International Airport (TIA)has been criticized for the waiting times associated with
Departing flights.While the critics acknowledge that many flights have little or no waiting times,
Their complaints deal more specifically with the longer waits attributed to some flights.The
Critics are interested in showing, mathematically, exactly what the problems are.Which type of
Distribution would best model the waiting times of the departing flights at TIA?
(Multiple Choice)
4.8/5 (43)
Filters
- Essay(0)
- Multiple Choice(0)
- Short Answer(0)
- True False(0)
- Matching(0)