Exam 18: A Roadmap for Analyzing Data
Exam 1: Defining and Collecting Data200 Questions
Exam 2: Organizing and Visualizing189 Questions
Exam 3: Numerical Descriptive Measures80 Questions
Exam 4: Basic Probability108 Questions
Exam 5: Discrete Probability Distributions81 Questions
Exam 6: Conthe Tinuonormausl Disdis Tributionstribution and Other38 Questions
Exam 7: Sampling Distributions62 Questions
Exam 8: Confidence Interval Estimation139 Questions
Exam 9: Fundamentals of Hypothesis Testing: One-Sample Tests133 Questions
Exam 10: Two-Sample Tests95 Questions
Exam 11: Analysis of Variance73 Questions
Exam 12: Chi-Square and Nonparametric100 Questions
Exam 13: Simple Linear Regression89 Questions
Exam 14: Introduction to Multiple113 Questions
Exam 15: Multiple Regression62 Questions
Exam 16: Time-Series Forecasting61 Questions
Exam 17: Business Analytics102 Questions
Exam 18: A Roadmap for Analyzing Data133 Questions
Exam 19: Statistical Applications in Quality Management86 Questions
Exam 20: Decision Making121 Questions
Select questions type
It was believed that the probability of being hit by lightning is the same during the course of a
Thunderstorm.Which of the following distributions would you use to determine the probability
Of being hit by a lightning during the first half of a thunderstorm?
(Multiple Choice)
4.9/5  (26)
(26)
The opinions (classified as "for", "neutral" or "against")of a sample of 200 people broken down
by gender about the latest congressional plan to eliminate anti-trust exemptions for professional
baseball.You can present this information using a scatter plot.
(True/False)
4.8/5 (37)
A certain type of new business succeeds 60% of the time.Suppose that 3 such businesses open
(where they do not compete with each other, so it is reasonable to believe that their relative
Successes would be independent).Which of the following distributions would you use to
Determine the probability that all of them will fail?
(Multiple Choice)
4.9/5 (30)
Suppose the probability of a car accident taking place anywhere on a stretch of a 20 miles
Highway is the same.Which of the following distributions would you use to determine the
Probability that a car accident will occur somewhere between the 5-mile and 15-mile posts of the
Highway?
(Multiple Choice)
5.0/5 (30)
The director of admissions at a state college is interested in seeing if admissions status (admitted,
Waiting list, denied admission)at his college is related to the type of community (urban, rural,
Suburban)in which an applicant resides.Which of the following tests will be the most
Appropriate?
(Multiple Choice)
4.8/5 (41)
SCENARIO 18-9
What are the factors that determine the acceleration time (in sec.)from 0 to 60 miles per hour of a
car? Data on the following variables for 171 different vehicle models were collected:
Accel Time: Acceleration time in sec.
Cargo Vol: Cargo volume in cu.ft.
HP: Horsepower
MPG: Miles per gallon
SUV: 1 if the vehicle model is an SUV with Coupe as the base when SUV and Sedan are both 0
Sedan: 1 if the vehicle model is a sedan with Coupe as the base when SUV and Sedan are both 0
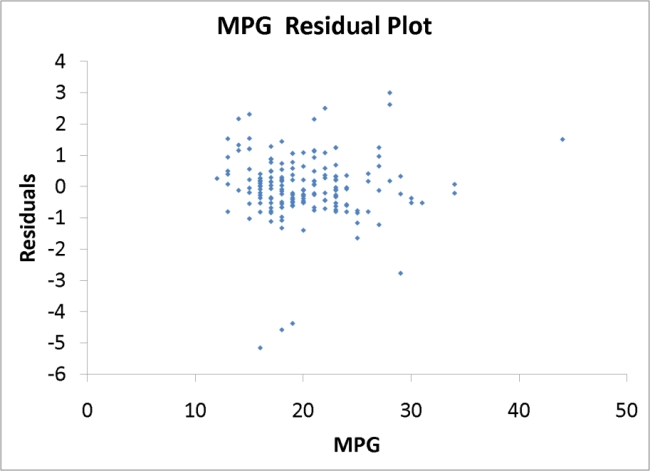
The regression results using acceleration time as the dependent variable and the remaining variables
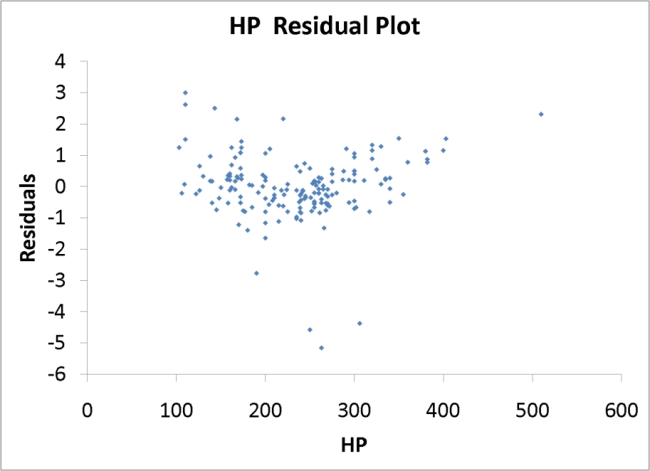
as the independent variables are presented below. 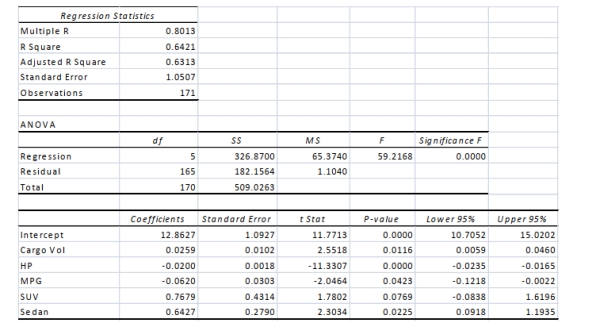 The various residual plots are as shown below.
 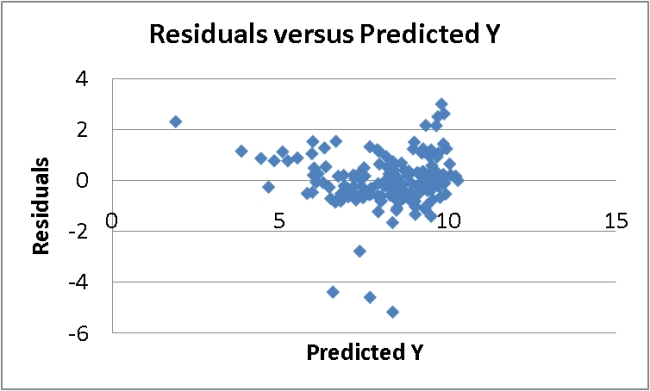 A Roadmap for Analyzing Data 18-63
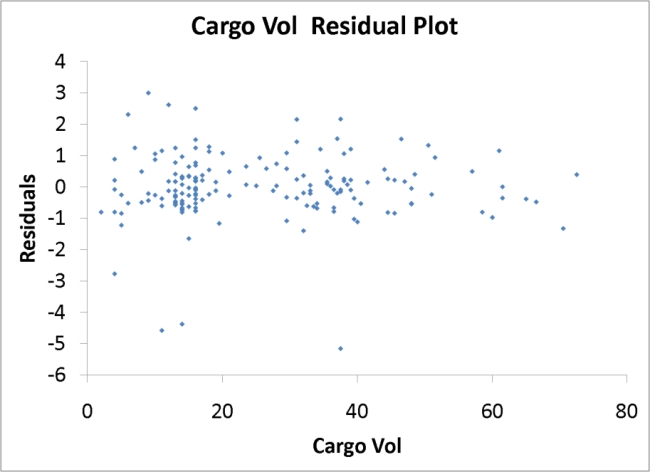
 18-64 A Roadmap for Analyzing Data
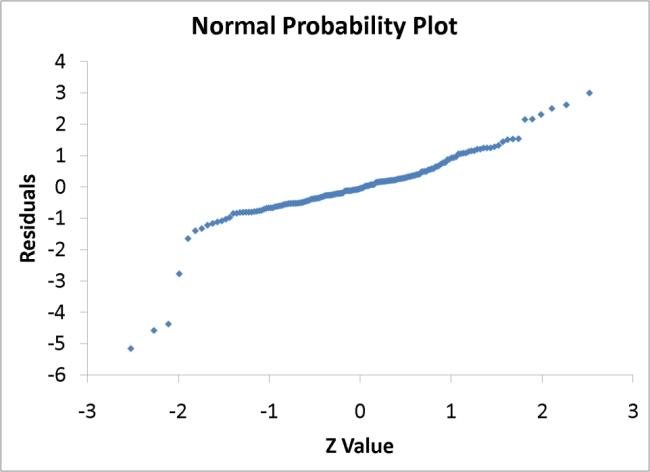
 -Referring to Scenario 18-9, what is the correct interpretation for the estimated coefficient for
HP?
-Referring to Scenario 18-9, what is the correct interpretation for the estimated coefficient for
HP?
(Multiple Choice)
4.9/5 (45)
The quality control manager of a candy plant is inspecting a batch of chocolate chip bags.When
The production process is in control, the average number of blue chocolate chips per bag is 6.0.
Suppose that the probability of a blue chocolate chip in a bag is constant across bags and the
Number of blue chocolate chips in one bag is independent of the number in any other bag.Which
Of the following distributions would you use to figure out the probability that any particular bag
Being inspected has 4.0 blue chocolate chips?
(Multiple Choice)
4.9/5 (22)
SCENARIO 18-2 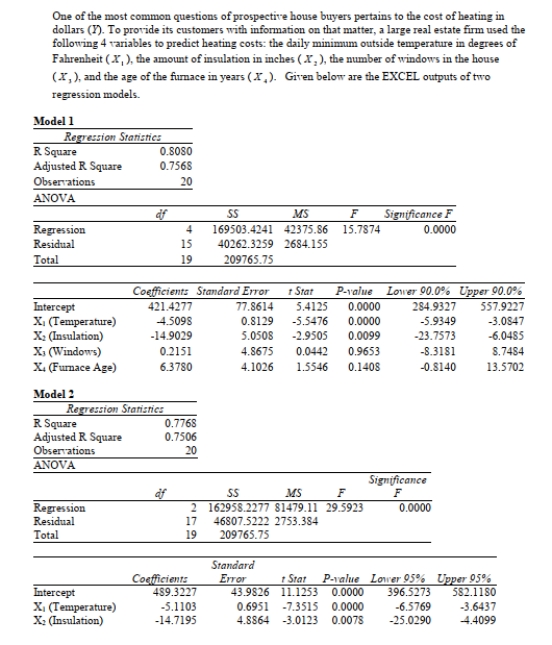 -Referring to Scenario 18-2, what is the 90% confidence interval for the expected change in
Heating costs as a result of a 1 degree Fahrenheit change in the daily minimum outside
Temperature using Model 1?
-Referring to Scenario 18-2, what is the 90% confidence interval for the expected change in
Heating costs as a result of a 1 degree Fahrenheit change in the daily minimum outside
Temperature using Model 1? 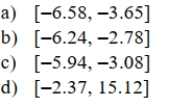
(Multiple Choice)
4.8/5 (32)
SCENARIO 18-1
A real estate builder wishes to determine how house size (House)is influenced by family income
(Income), family size (Size), and education of the head of household (School).House size is
measured in hundreds of square feet, income is measured in thousands of dollars, and education is in
years.The builder randomly selected 50 families and ran the multiple regression.Microsoft Excel
output is provided below: 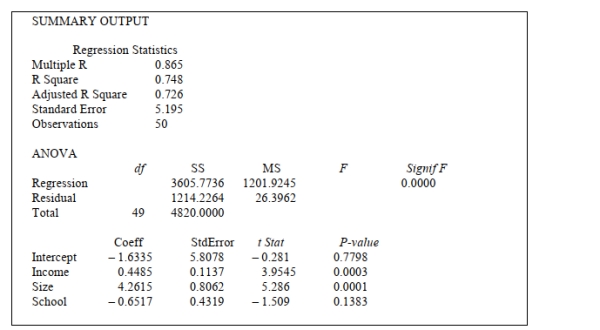 -Referring to Scenario 18-1, which of the following values for the level of significance is the
Smallest for which every explanatory variable is significant individually?
-Referring to Scenario 18-1, which of the following values for the level of significance is the
Smallest for which every explanatory variable is significant individually?
(Multiple Choice)
4.8/5 (27)
A wheel spinning game is played with a special wheel with 24 equal segments that determine the
Dollar values of a single spin.Which of the following distributions can best be used to compute
The probability of winning a specific dollar value in a single spin?
(Multiple Choice)
5.0/5 (36)
A political pollster randomly selects a sample of 100 voters each day for 8 successive days and
Asks how many will vote for the incumbent.The pollster wishes to see if the percentage favoring
The incumbent candidate is too erratic.Which of the following would be the most appropriate
Analysis to perform?
(Multiple Choice)
4.9/5 (37)
A survey was conducted to determine how people rated the quality of programming available on
television.Respondents were asked to rate the overall quality from 0 (no quality at all)to 100
(extremely good quality).An cumulative percentage polygon (ogive)can be used to present this
information.
(True/False)
4.9/5 (29)
SCENARIO 18-1
A real estate builder wishes to determine how house size (House)is influenced by family income
(Income), family size (Size), and education of the head of household (School).House size is
measured in hundreds of square feet, income is measured in thousands of dollars, and education is in
years.The builder randomly selected 50 families and ran the multiple regression.Microsoft Excel
output is provided below:
-Referring to Scenario 18-1, at the 0.01 level of significance, what conclusion should the builder
Draw regarding the inclusion of School in the regression model?
(Multiple Choice)
4.7/5 (33)
A physician and president of a Tampa Health Maintenance Organization (HMO)are attempting
To show the benefits of managed health care to an insurance company.The physician believes
That certain types of doctors are more cost-effective than others.To investigate this, the president
Obtained independent random samples of 20 HMO physicians from each of 4 primary specialties
- General Practice (GP), Internal Medicine (IM), Pediatrics (PED), and Family Physicians (FP)-
And recorded the total charges per member per month for each.A second variable which the
President believes influences total charges per member per month is whether the doctor is a
Foreign or USA medical school graduate.To investigate this, the president also collected data on
20 foreign medical school graduates in each of the 4 primary specialty types described above.So
Information on charges for 40 doctors (20 foreign and 20 USA medical school graduates)was obtained for each of the 4 specialties.The president has already found out that specialty types
And origin of the medical degree do not interact to affect the charges.He has also found out
Special types do have an impact on average charges.Which of the following tests will be the
Most appropriate to find out which primary specialty has the highest charges?
(Multiple Choice)
4.8/5 (40)
Data on the amount of money made in a year by 1000 families in a small town were collected.
You want to know the difference in the amount of money made in that year by the middle 50% of
The 1,000 families.Which of the following would you compute?
(Multiple Choice)
4.7/5 (38)
A Paso Robles wine producer wanted to forecast the cases of Merlot wine sold.The number of
Cases of merlot wine sold in a 28-year period was collected.Which of the following would be
The most appropriate analysis to perform?
(Multiple Choice)
4.8/5 (27)
An investor wanted to forecast the price of a certain stock.He collected the mean daily price for
The stock over the past 10 years.Which of the following would be the most appropriate analysis
To perform?
(Multiple Choice)
5.0/5 (37)
Filters
- Essay(0)
- Multiple Choice(0)
- Short Answer(0)
- True False(0)
- Matching(0)