Exam 18: A Roadmap for Analyzing Data
Exam 1: Defining and Collecting Data200 Questions
Exam 2: Organizing and Visualizing189 Questions
Exam 3: Numerical Descriptive Measures80 Questions
Exam 4: Basic Probability108 Questions
Exam 5: Discrete Probability Distributions81 Questions
Exam 6: Conthe Tinuonormausl Disdis Tributionstribution and Other38 Questions
Exam 7: Sampling Distributions62 Questions
Exam 8: Confidence Interval Estimation139 Questions
Exam 9: Fundamentals of Hypothesis Testing: One-Sample Tests133 Questions
Exam 10: Two-Sample Tests95 Questions
Exam 11: Analysis of Variance73 Questions
Exam 12: Chi-Square and Nonparametric100 Questions
Exam 13: Simple Linear Regression89 Questions
Exam 14: Introduction to Multiple113 Questions
Exam 15: Multiple Regression62 Questions
Exam 16: Time-Series Forecasting61 Questions
Exam 17: Business Analytics102 Questions
Exam 18: A Roadmap for Analyzing Data133 Questions
Exam 19: Statistical Applications in Quality Management86 Questions
Exam 20: Decision Making121 Questions
Select questions type
SCENARIO 18-9
What are the factors that determine the acceleration time (in sec.)from 0 to 60 miles per hour of a
car? Data on the following variables for 171 different vehicle models were collected:
Accel Time: Acceleration time in sec.
Cargo Vol: Cargo volume in cu.ft.
HP: Horsepower
MPG: Miles per gallon
SUV: 1 if the vehicle model is an SUV with Coupe as the base when SUV and Sedan are both 0
Sedan: 1 if the vehicle model is a sedan with Coupe as the base when SUV and Sedan are both 0
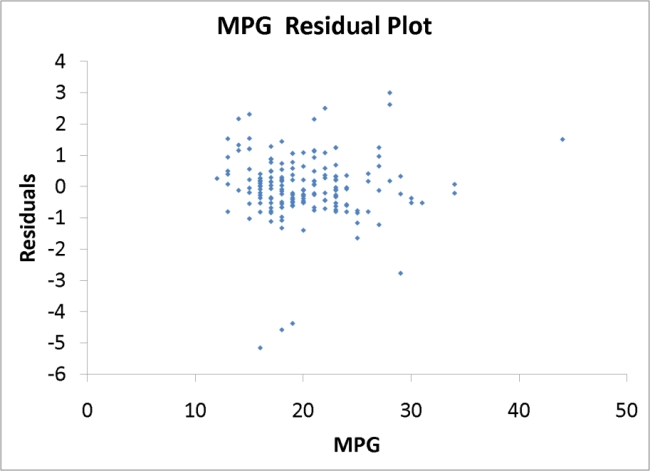
The regression results using acceleration time as the dependent variable and the remaining variables
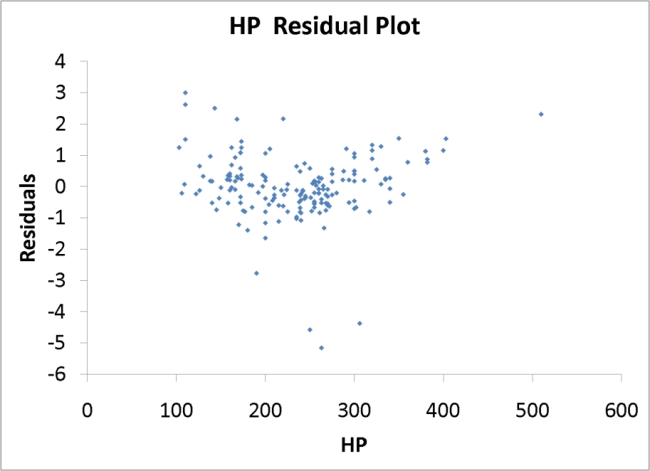
as the independent variables are presented below. 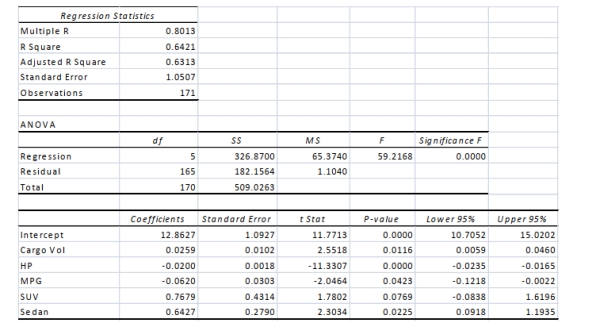 The various residual plots are as shown below.
 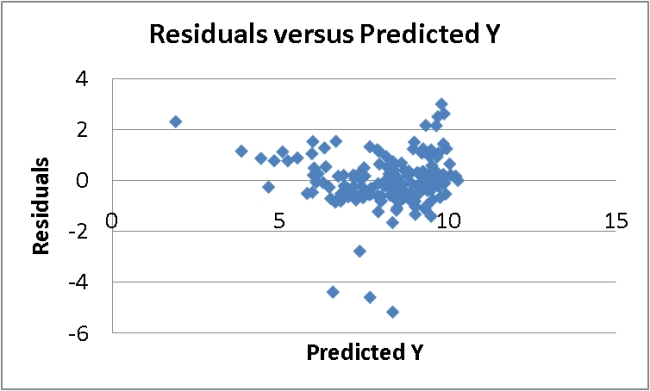 A Roadmap for Analyzing Data 18-63
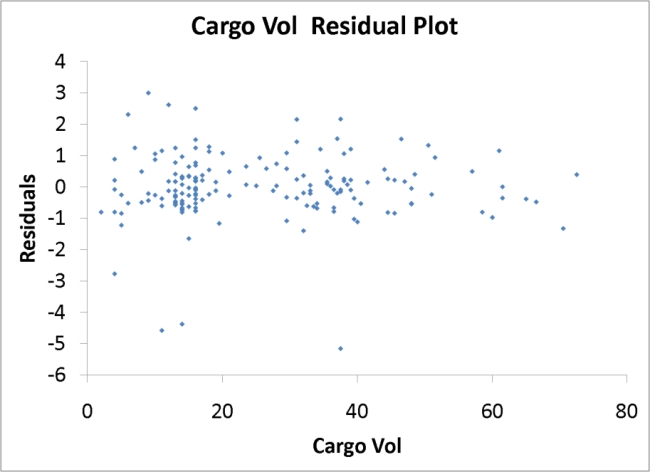
 18-64 A Roadmap for Analyzing Data
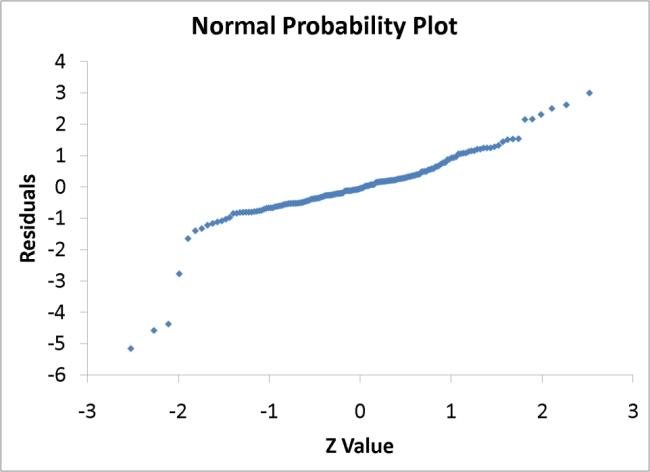
 -True or False: Referring to Scenario 18-9, the 0 to 60 miles per hour acceleration time of a
coupe is predicted to be 0.6427 seconds lower than that of a sedan.
-True or False: Referring to Scenario 18-9, the 0 to 60 miles per hour acceleration time of a
coupe is predicted to be 0.6427 seconds lower than that of a sedan.
(True/False)
4.9/5  (23)
(23)
SCENARIO 18-1
A real estate builder wishes to determine how house size (House)is influenced by family income
(Income), family size (Size), and education of the head of household (School).House size is
measured in hundreds of square feet, income is measured in thousands of dollars, and education is in
years.The builder randomly selected 50 families and ran the multiple regression.Microsoft Excel
output is provided below: 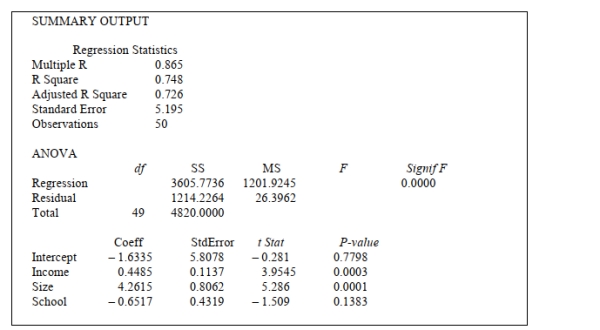 -Referring to Scenario 18-1, what minimum annual income would an individual with a family size
Of 4 and 16 years of education need to attain a predicted 10,000 square foot home (House =
100)?
-Referring to Scenario 18-1, what minimum annual income would an individual with a family size
Of 4 and 16 years of education need to attain a predicted 10,000 square foot home (House =
100)?
(Multiple Choice)
4.9/5 (34)
From an inventory of 48 new cars being shipped to local dealerships, corporate reports indicate
That 12 have defective radios installed.Which of the following distributions would you use to
Determine the probability that out of the 8 new cars it just received that, when each is tested, no
More than 2 of the cars have defective radios?
(Multiple Choice)
4.8/5 (36)
True or False: An insurance company evaluates many variables about a person before deciding
on an appropriate rate for automobile insurance.A representative from a local insurance agency
selected a random sample of 100 insured drivers and recorded, X, the amount of claims each
made in the last 3 years.A Pareto chart can be used to present this information.
(True/False)
4.7/5 (36)
SCENARIO 18-6 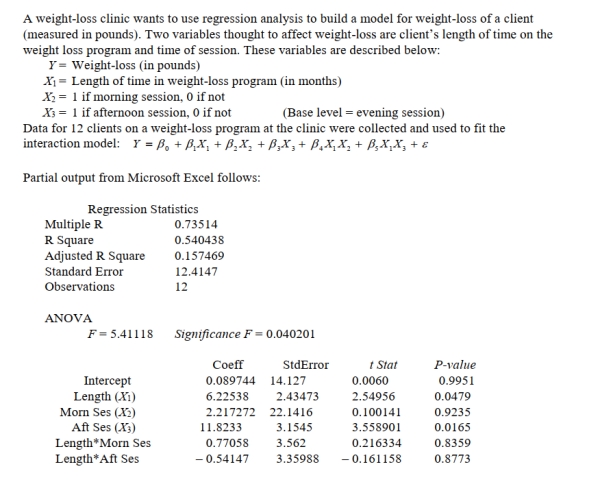 -Referring to Scenario 18-6, in terms of the
  s in the model, give the mean change in weight-
Loss (Y)for every 1 month increase in time in the program
s in the model, give the mean change in weight-
Loss (Y)for every 1 month increase in time in the program  When attending the morning
Session.
When attending the morning
Session. 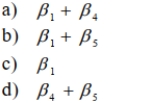
(Multiple Choice)
4.8/5 (33)
Suppose students arrive at an advising office at a rate of 30 per hour.Which of the following
Distributions would you use to determine the probability that the next two students will arrive 30
Minutes apart?
(Multiple Choice)
4.8/5 (39)
Data on the amount of time spent studying for a particular exam at a high school were collected
For 150 students.You want to know half of the students spent at least how much time studying
For that exam.Which of the following would you compute?
(Multiple Choice)
4.9/5 (32)
SCENARIO 18-1
A real estate builder wishes to determine how house size (House)is influenced by family income
(Income), family size (Size), and education of the head of household (School).House size is
measured in hundreds of square feet, income is measured in thousands of dollars, and education is in
years.The builder randomly selected 50 families and ran the multiple regression.Microsoft Excel
output is provided below:
-Referring to Scenario 18-1, suppose the builder wants to test whether the coefficient on School is
Significantly different from 0.What is the value of the relevant t-statistic?
(Multiple Choice)
4.9/5 (33)
SCENARIO 18-9
What are the factors that determine the acceleration time (in sec.)from 0 to 60 miles per hour of a
car? Data on the following variables for 171 different vehicle models were collected:
Accel Time: Acceleration time in sec.
Cargo Vol: Cargo volume in cu.ft.
HP: Horsepower
MPG: Miles per gallon
SUV: 1 if the vehicle model is an SUV with Coupe as the base when SUV and Sedan are both 0
Sedan: 1 if the vehicle model is a sedan with Coupe as the base when SUV and Sedan are both 0
The regression results using acceleration time as the dependent variable and the remaining variables
as the independent variables are presented below. The various residual plots are as shown below.
A Roadmap for Analyzing Data 18-63
18-64 A Roadmap for Analyzing Data
-Referring to Scenario 18-9, what is the correct interpretation for the estimated coefficient for
Sedan?
(Multiple Choice)
4.7/5 (37)
SCENARIO 18-9
What are the factors that determine the acceleration time (in sec.)from 0 to 60 miles per hour of a
car? Data on the following variables for 171 different vehicle models were collected:
Accel Time: Acceleration time in sec.
Cargo Vol: Cargo volume in cu.ft.
HP: Horsepower
MPG: Miles per gallon
SUV: 1 if the vehicle model is an SUV with Coupe as the base when SUV and Sedan are both 0
Sedan: 1 if the vehicle model is a sedan with Coupe as the base when SUV and Sedan are both 0
The regression results using acceleration time as the dependent variable and the remaining variables
as the independent variables are presented below. The various residual plots are as shown below.
A Roadmap for Analyzing Data 18-63
18-64 A Roadmap for Analyzing Data
-True or False: Referring to Scenario 18-9, the 0 to 60 miles per hour acceleration time of a
coupe is predicted to be 0.7679 seconds higher than that of a sedan.
(True/False)
4.9/5 (34)
The use of preservatives by food processors has become a controversial issue.Suppose 2
Preservatives are extensively tested and determined safe for use in meats.A processor wants to compare the preservatives for their effects on retarding spoilage.They will choose to use the
Preservative that can keep the meat fresh for the longest amount of time.Suppose 15 cuts of
Fresh meat are treated with preservative I and 15 are treated with preservative II, and the number
Of hours until spoilage begins is recorded for each of the 30 cuts of meat.Suppose the variability
Of the number of hours until spoilage is the same for meat treated by both preservatives but the
Normal probability plots reveal that the number of hours until spoilage is right-skewed for the 15
Cuts treated by preservative I and left-skewed for the 15 cuts treated with preservative II.Which
Of the following tests will be the most appropriate?
(Multiple Choice)
4.8/5 (36)
A pizza chain is considering opening a new store in an area that currently does not have any such
Stores.The chain will open if there is evidence that more than 5,000 of the 20,000 households in
The area have a favorable view of its brain.It conducts a telephone poll of 300 randomly selected
Households in the area and finds that 96 have a favorable view.Which of the following tests will
Be the most appropriate?
(Multiple Choice)
4.8/5 (36)
Filters
- Essay(0)
- Multiple Choice(0)
- Short Answer(0)
- True False(0)
- Matching(0)