Exam 18: A Roadmap for Analyzing Data
Exam 1: Defining and Collecting Data200 Questions
Exam 2: Organizing and Visualizing189 Questions
Exam 3: Numerical Descriptive Measures80 Questions
Exam 4: Basic Probability108 Questions
Exam 5: Discrete Probability Distributions81 Questions
Exam 6: Conthe Tinuonormausl Disdis Tributionstribution and Other38 Questions
Exam 7: Sampling Distributions62 Questions
Exam 8: Confidence Interval Estimation139 Questions
Exam 9: Fundamentals of Hypothesis Testing: One-Sample Tests133 Questions
Exam 10: Two-Sample Tests95 Questions
Exam 11: Analysis of Variance73 Questions
Exam 12: Chi-Square and Nonparametric100 Questions
Exam 13: Simple Linear Regression89 Questions
Exam 14: Introduction to Multiple113 Questions
Exam 15: Multiple Regression62 Questions
Exam 16: Time-Series Forecasting61 Questions
Exam 17: Business Analytics102 Questions
Exam 18: A Roadmap for Analyzing Data133 Questions
Exam 19: Statistical Applications in Quality Management86 Questions
Exam 20: Decision Making121 Questions
Select questions type
A manager of a product sales group believes the number of sales made by an employee depends
On how many years that employee has been with the company and how he/she scored on a
Business aptitude test.A random sample of 38 employees was selected to collect data on their
Number of sales, number of years with the company and scores on a business aptitude test.
Which of the following would you perform to draw conclusion on the belief?
(Multiple Choice)
4.9/5  (42)
(42)
SCENARIO 18-1
A real estate builder wishes to determine how house size (House)is influenced by family income
(Income), family size (Size), and education of the head of household (School).House size is
measured in hundreds of square feet, income is measured in thousands of dollars, and education is in
years.The builder randomly selected 50 families and ran the multiple regression.Microsoft Excel
output is provided below: 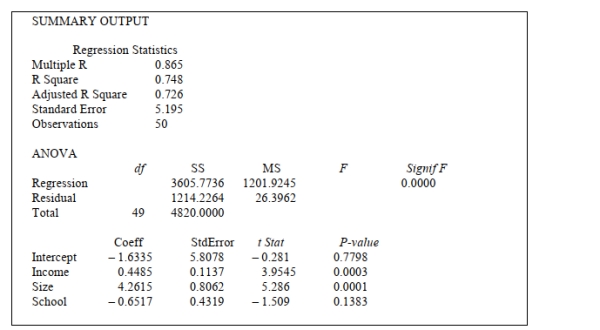 -Referring to Scenario 18-1, suppose the builder wants to test whether the coefficient on Income
Is significantly different from 0.What is the value of the relevant t-statistic?
-Referring to Scenario 18-1, suppose the builder wants to test whether the coefficient on Income
Is significantly different from 0.What is the value of the relevant t-statistic?
(Multiple Choice)
4.7/5 (46)
The probability that a particular brand of smoke alarm will malfunction in the presence of smoke
Is 0.002.A batch of 100,000 such alarms was produced by independent production lines.Which
Of the following distributions would you use to figure out the probability that at most 5,000 of
Them will malfunction in case of a fire?
(Multiple Choice)
4.8/5 (38)
SCENARIO 18-2 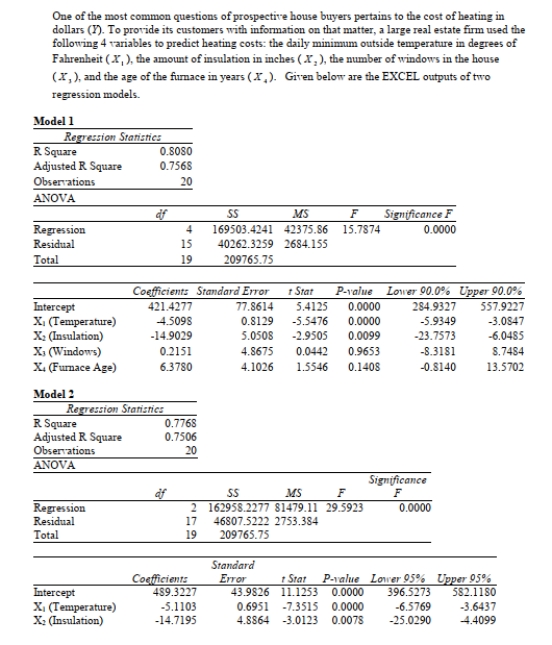 -Referring to Scenario 18-2, what are the degrees of freedom of the partial F test for
(Multiple Choice)
4.7/5 (29)
The owner of a local nightclub has recently surveyed a random sample of n = 250 customers of
The club.She would now like to determine whether or not the mean age of her customers is more
Than 30.If so, she plans to alter the entertainment to appeal to an older crowd.If not, no
Entertainment changes will be made.Which of the following tests will you perform to help her
Make a decision?
(Multiple Choice)
4.7/5 (34)
SCENARIO 18-1
A real estate builder wishes to determine how house size (House)is influenced by family income
(Income), family size (Size), and education of the head of household (School).House size is
measured in hundreds of square feet, income is measured in thousands of dollars, and education is in
years.The builder randomly selected 50 families and ran the multiple regression.Microsoft Excel
output is provided below:
-Referring to Scenario 18-1, what minimum annual income would an individual with a family size
Of 9 and 10 years of education need to attain a predicted 5,000 square foot home (House = 50)?
(Multiple Choice)
4.8/5 (34)
SCENARIO 18-1
A real estate builder wishes to determine how house size (House)is influenced by family income
(Income), family size (Size), and education of the head of household (School).House size is
measured in hundreds of square feet, income is measured in thousands of dollars, and education is in
years.The builder randomly selected 50 families and ran the multiple regression.Microsoft Excel
output is provided below:
-Referring to Scenario 18-1, which of the independent variables in the model are significant at the
5% level?
(Multiple Choice)
4.8/5 (33)
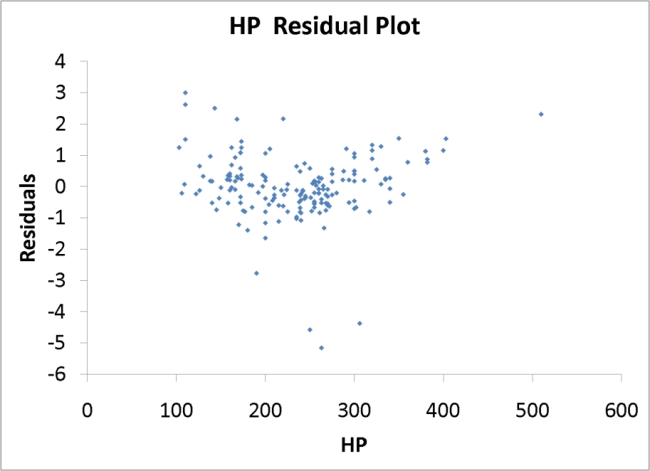
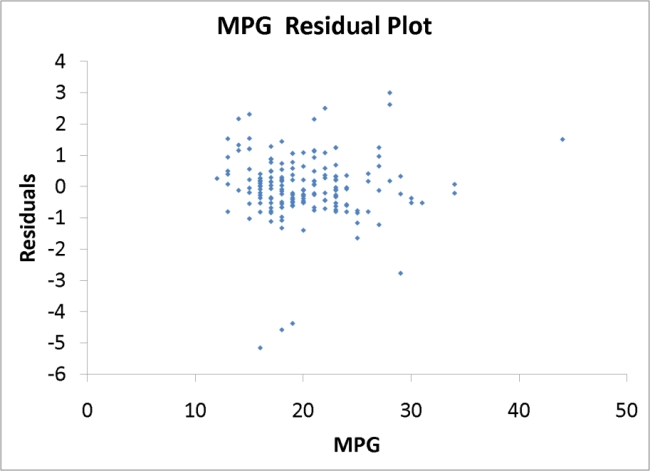
SCENARIO 18-9
What are the factors that determine the acceleration time (in sec.)from 0 to 60 miles per hour of a
car? Data on the following variables for 171 different vehicle models were collected:
Accel Time: Acceleration time in sec.
Cargo Vol: Cargo volume in cu.ft.
HP: Horsepower
MPG: Miles per gallon
SUV: 1 if the vehicle model is an SUV with Coupe as the base when SUV and Sedan are both 0
Sedan: 1 if the vehicle model is a sedan with Coupe as the base when SUV and Sedan are both 0
The regression results using acceleration time as the dependent variable and the remaining variables
as the independent variables are presented below. 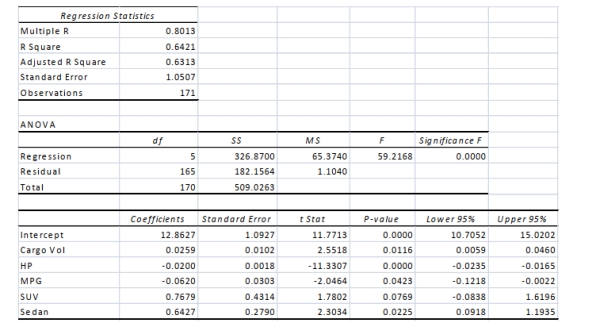 The various residual plots are as shown below.
 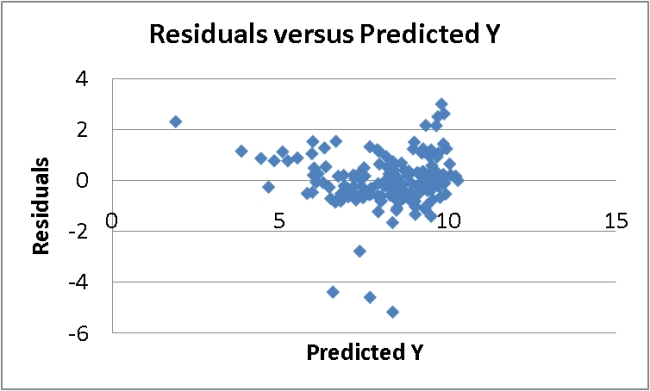 A Roadmap for Analyzing Data 18-63
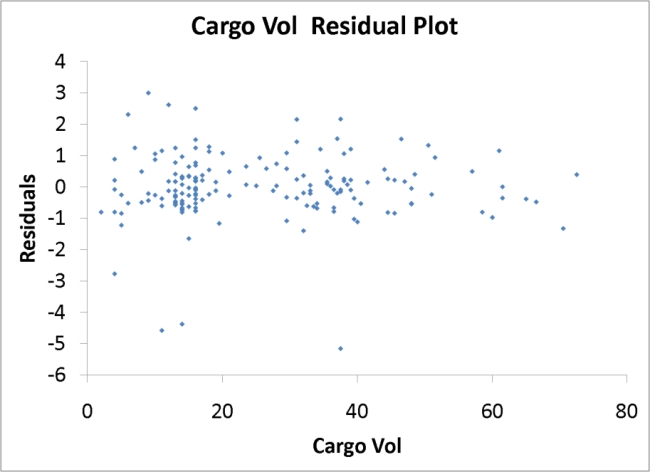
 18-64 A Roadmap for Analyzing Data
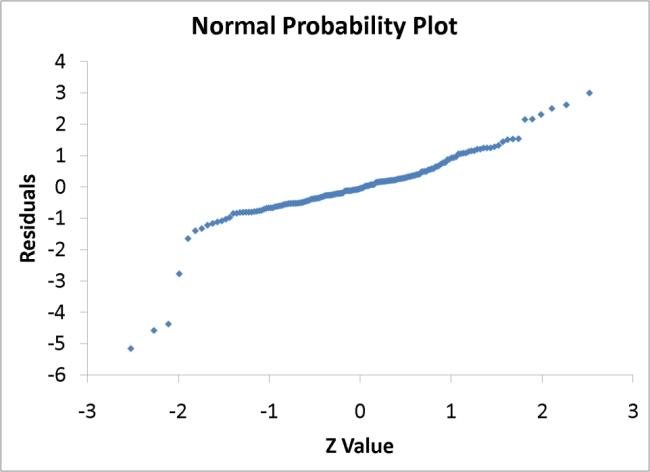
 -Referring to Scenario 18-9, what is the correct interpretation for the estimated coefficient for
SUV?
-Referring to Scenario 18-9, what is the correct interpretation for the estimated coefficient for
SUV?
(Multiple Choice)
4.8/5 (31)
SCENARIO 18-1
A real estate builder wishes to determine how house size (House)is influenced by family income
(Income), family size (Size), and education of the head of household (School).House size is
measured in hundreds of square feet, income is measured in thousands of dollars, and education is in
years.The builder randomly selected 50 families and ran the multiple regression.Microsoft Excel
output is provided below:
-Referring to Scenario 18-1, what is the value of the calculated F test statistic that is missing from
The output for testing whether the whole regression model is significant?
(Multiple Choice)
4.8/5 (31)
SCENARIO 18-1
A real estate builder wishes to determine how house size (House)is influenced by family income
(Income), family size (Size), and education of the head of household (School).House size is
measured in hundreds of square feet, income is measured in thousands of dollars, and education is in
years.The builder randomly selected 50 families and ran the multiple regression.Microsoft Excel
output is provided below:
-Referring to Scenario 18-1, what are the residual degrees of freedom that are missing from the
Output?
(Multiple Choice)
4.8/5 (35)
An airline wants to select a computer software package for its reservation system.Four software
Packages (1, 2, 3, and 4)are commercially available.An experiment is set up in which each
Package is used to make reservations for 5 randomly selected weeks and data on the number of
Passengers that are bumped over a month are collected.(A total of 20 weeks was included in the
Experiment.)The variability of the number of passengers that are bumped is found to be roughly
The same for the 4 packages.The distribution on the number of passengers that are bumped has
Been found out to be right-skewed for package 1 and 4, left-skewed for package 2 and normal for
Package 3.Which of the following tests will be the most appropriate to find out if the mean
Number of passengers being bumped over a month is the same across the 4 packages?
(Multiple Choice)
4.8/5 (34)
A Paso Robles wine producer wanted to forecast the cases of Merlot wine sold.The number of
Cases of merlot wine sold in a 28-year period was collected.Which of the following would be
The most appropriate analysis to perform?
(Multiple Choice)
4.9/5 (34)
SCENARIO 18-1
A real estate builder wishes to determine how house size (House)is influenced by family income
(Income), family size (Size), and education of the head of household (School).House size is
measured in hundreds of square feet, income is measured in thousands of dollars, and education is in
years.The builder randomly selected 50 families and ran the multiple regression.Microsoft Excel
output is provided below:
-Referring to Scenario 18-1, what is the predicted house size (in hundreds of square feet)for an
Individual earning an annual income of $40,000, having a family size of 4, and going to school a
Total of 13 years?
(Multiple Choice)
4.9/5 (33)
SCENARIO 18-1
A real estate builder wishes to determine how house size (House)is influenced by family income
(Income), family size (Size), and education of the head of household (School).House size is
measured in hundreds of square feet, income is measured in thousands of dollars, and education is in
years.The builder randomly selected 50 families and ran the multiple regression.Microsoft Excel
output is provided below:
-Referring to Scenario 18-1, at the 0.01 level of significance, what conclusion should the builder
Reach regarding the inclusion of Income in the regression model?
(Multiple Choice)
4.9/5 (31)
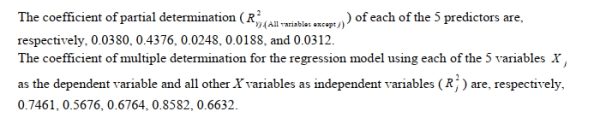
SCENARIO 18-6 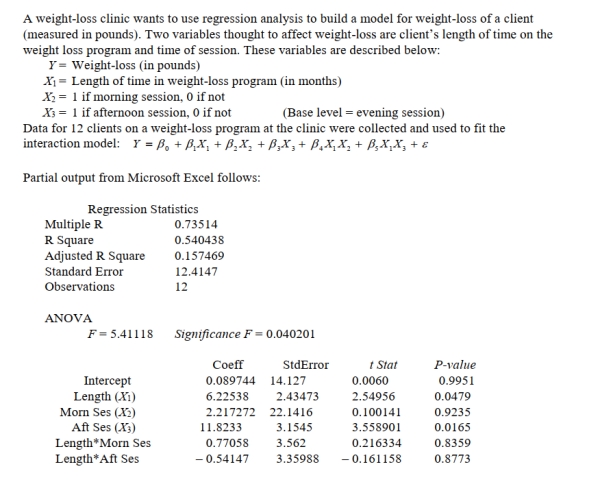 -Referring to Scenario 18-6, in terms of the
  s in the model, give the mean change in weight-
Loss (Y)for every 1 month increase in time in the program
s in the model, give the mean change in weight-
Loss (Y)for every 1 month increase in time in the program  When attending the evening
Session.
When attending the evening
Session. 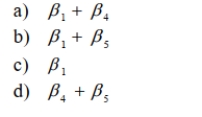
(Multiple Choice)
4.8/5 (38)
Data were collected on the amount of detergent used in gallons in a month by 25 drive-through
car wash operations in Phoenix.You can use a time-series plot to pressing this information.
(True/False)
4.8/5 (41)
SCENARIO 18-1
A real estate builder wishes to determine how house size (House)is influenced by family income
(Income), family size (Size), and education of the head of household (School).House size is
measured in hundreds of square feet, income is measured in thousands of dollars, and education is in
years.The builder randomly selected 50 families and ran the multiple regression.Microsoft Excel
output is provided below:
-Referring to Scenario 18-1, which of the following values for the level of significance is the
Smallest for which the regression model as a whole is significant?
(Multiple Choice)
4.9/5 (37)
A debate team of 4 members for a high school will be chosen randomly from a potential group
Of 15 students.Ten of the 15 students have no prior competition experience while the others
Have some degree of experience.Which of the following distributions would you use to
Determine the probability that none of the members chosen for the team have any competition
Experience?
(Multiple Choice)
4.7/5 (35)
A professor of economics at a small Texas university wanted to determine what year in school
students were taking his tough economics course.Data were collected on the class status
("freshman", "sophomore", "junior" or "senior")of 50 students enrolled in one of his economics
course.A side-by-side bar chart can be used to present this information.
(True/False)
4.9/5 (29)
Filters
- Essay(0)
- Multiple Choice(0)
- Short Answer(0)
- True False(0)
- Matching(0)