Exam 2: Organizing and Visualizing
Exam 1: Defining and Collecting Data200 Questions
Exam 2: Organizing and Visualizing189 Questions
Exam 3: Numerical Descriptive Measures80 Questions
Exam 4: Basic Probability108 Questions
Exam 5: Discrete Probability Distributions81 Questions
Exam 6: Conthe Tinuonormausl Disdis Tributionstribution and Other38 Questions
Exam 7: Sampling Distributions62 Questions
Exam 8: Confidence Interval Estimation139 Questions
Exam 9: Fundamentals of Hypothesis Testing: One-Sample Tests133 Questions
Exam 10: Two-Sample Tests95 Questions
Exam 11: Analysis of Variance73 Questions
Exam 12: Chi-Square and Nonparametric100 Questions
Exam 13: Simple Linear Regression89 Questions
Exam 14: Introduction to Multiple113 Questions
Exam 15: Multiple Regression62 Questions
Exam 16: Time-Series Forecasting61 Questions
Exam 17: Business Analytics102 Questions
Exam 18: A Roadmap for Analyzing Data133 Questions
Exam 19: Statistical Applications in Quality Management86 Questions
Exam 20: Decision Making121 Questions
Select questions type
The addition of visual elements that either fail to convey any useful information or that obscure
important points about the data in an attempt to enhance the visualization of data is called
_______.
(Essay)
4.8/5  (28)
(28)
A _______ is a summary table in which numerical data are tallied into class intervals or
categories.
(Essay)
4.9/5 (41)
SCENARIO 2-4
A survey was conducted to determine how people rated the quality of programming available on
television.Respondents were asked to rate the overall quality from 0 (no quality at all)to 100
(extremely good quality).The stem-and-leaf display of the data is shown below. 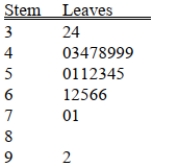 -Referring to Scenario 2-4, what percentage of the respondents rated overall television quality
With a rating of 50 or below?
-Referring to Scenario 2-4, what percentage of the respondents rated overall television quality
With a rating of 50 or below?
(Multiple Choice)
4.9/5 (36)
True or False: A good choice for the number of class groups to use in constructing frequency
distribution is to have at least 5 but no more than 15 class groups.
(True/False)
4.9/5 (38)
Which of the following is appropriate for displaying data collected on the different brands of cars
Students at a major university drive?
(Multiple Choice)
4.9/5 (34)
SCENARIO 2-12
The table below contains the opinions of a sample of 200 people broken down by gender about the
latest congressional plan to eliminate anti-trust exemptions for professional baseball. 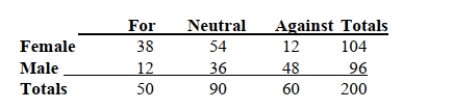 -Referring to Scenario 2-12, ________ percent of the 200 were males.
(Essay)
4.9/5 (36)
You have collected data on the number of U.S.households actively using online banking and/or
Online bill payment over a 10-year period.Which of the following is the best for presenting the
Data?
(Multiple Choice)
4.7/5 (32)
SCENARIO 2-7 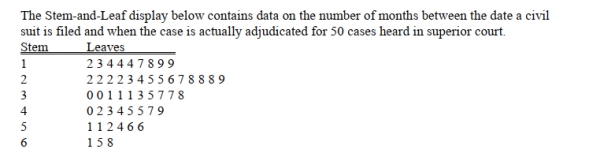 -Referring to Scenario 2-7, ________ percent of the cases were not adjudicated within the first 4
years.
-Referring to Scenario 2-7, ________ percent of the cases were not adjudicated within the first 4
years.
(Essay)
4.9/5 (38)
Filters
- Essay(0)
- Multiple Choice(0)
- Short Answer(0)
- True False(0)
- Matching(0)