Exam 2: Organizing and Visualizing
Exam 1: Defining and Collecting Data200 Questions
Exam 2: Organizing and Visualizing189 Questions
Exam 3: Numerical Descriptive Measures80 Questions
Exam 4: Basic Probability108 Questions
Exam 5: Discrete Probability Distributions81 Questions
Exam 6: Conthe Tinuonormausl Disdis Tributionstribution and Other38 Questions
Exam 7: Sampling Distributions62 Questions
Exam 8: Confidence Interval Estimation139 Questions
Exam 9: Fundamentals of Hypothesis Testing: One-Sample Tests133 Questions
Exam 10: Two-Sample Tests95 Questions
Exam 11: Analysis of Variance73 Questions
Exam 12: Chi-Square and Nonparametric100 Questions
Exam 13: Simple Linear Regression89 Questions
Exam 14: Introduction to Multiple113 Questions
Exam 15: Multiple Regression62 Questions
Exam 16: Time-Series Forecasting61 Questions
Exam 17: Business Analytics102 Questions
Exam 18: A Roadmap for Analyzing Data133 Questions
Exam 19: Statistical Applications in Quality Management86 Questions
Exam 20: Decision Making121 Questions
Select questions type
SCENARIO 2-6
A sample of 200 students at a Big-Ten university was taken after the midterm to ask them whether
they went bar hopping the weekend before the midterm or spent the weekend studying, and whether
they did well or poorly on the midterm.The following table contains the result. 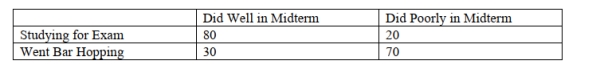 -Referring to Scenario 2-6, of those who went bar hopping the weekend before the midterm in the
Sample, _______ percent of them did well on the midterm.
-Referring to Scenario 2-6, of those who went bar hopping the weekend before the midterm in the
Sample, _______ percent of them did well on the midterm.
(Multiple Choice)
4.8/5  (33)
(33)
SCENARIO 2-6
A sample of 200 students at a Big-Ten university was taken after the midterm to ask them whether
they went bar hopping the weekend before the midterm or spent the weekend studying, and whether
they did well or poorly on the midterm.The following table contains the result.
-Referring to Scenario 2-6, of those who did well on the midterm in the sample, _______ percent
Of them went bar hopping the weekend before the midterm.
(Multiple Choice)
4.8/5 (42)
SCENARIO 2-12
The table below contains the opinions of a sample of 200 people broken down by gender about the
latest congressional plan to eliminate anti-trust exemptions for professional baseball. 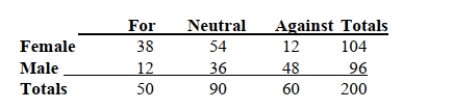 -Referring to Scenario 2-12, ________ percent of the 200 were males who were neutral.
(Essay)
4.9/5 (32)
When constructing charts, the following is plotted at the class midpoints:
(Multiple Choice)
4.7/5 (30)
True or False: When constructing a frequency distribution, classes should be selected so that they
are of equal width.
(True/False)
4.9/5 (32)
Referring to Scenario 2-11, construct a relative frequency or percentage distribution for the
defects data, using "0 but less than 5" as the first class.
(Essay)
4.7/5 (35)
SCENARIO 2-9
The frequency distribution below represents the rents of 250 randomly selected federally subsidized
apartments in a small town. 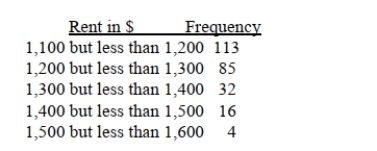 -Referring to Scenario 2-9, the class midpoint of the second class is ________.
(Essay)
4.9/5 (29)
You have collected data on the number of complaints for 6 different brands of automobiles sold
In the US over a 10-year period.Which of the following is the best for presenting the data?
(Multiple Choice)
4.8/5 (44)
True or False: Given below is the scatter plot of the market value (thousands$)and profit
(thousands$)of 50 U.S.companies.There appears to be a negative relationship between market
value and profit. 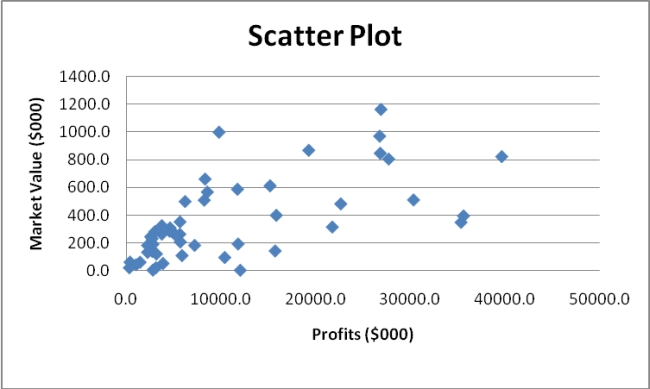
(True/False)
4.9/5 (34)
SCENARIO 2-18
The stem-and-leaf display below shows the result of a survey on 50 students on their satisfaction
with their school with the higher scores represent higher level of satisfaction. 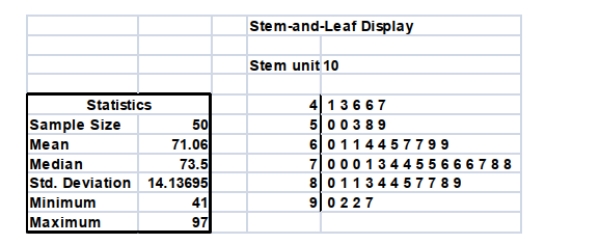 -Referring to Scenario 2-18, how many students have a satisfaction level of at least 80?
(Essay)
4.9/5 (38)
True or False: The stem-and-leaf display is often superior to the frequency distribution in that
it maintains the original values for further analysis.
(True/False)
4.9/5 (41)
SCENARIO 2-12
The table below contains the opinions of a sample of 200 people broken down by gender about the
latest congressional plan to eliminate anti-trust exemptions for professional baseball.
-Referring to Scenario 2-12, of those neutral in the sample, ________ percent were males.
(Essay)
4.8/5 (34)
True or False: A side-by-side bar chart is two histograms plotted side-by-side.
(True/False)
4.8/5 (38)
SCENARIO 2-14
The table below contains the number of people who own a portable Blu-ray player in a sample of 600
broken down by gender. 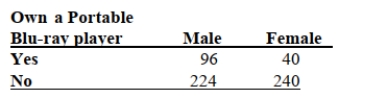 -Referring to Scenario 2-14, construct a table of column percentages.
(Essay)
4.9/5 (36)
True or False: Percentage polygons are plotted at the boundaries of the class groupings.
(True/False)
4.9/5 (36)
SCENARIO 2-7 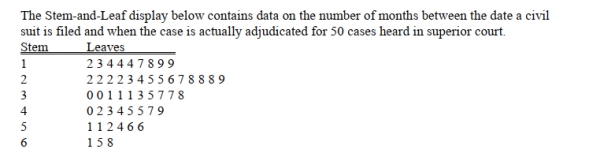 -Referring to Scenario 2-7, ________ percent of the cases were adjudicated within the first 2
years.
-Referring to Scenario 2-7, ________ percent of the cases were adjudicated within the first 2
years.
(Essay)
4.9/5 (43)
SCENARIO 2-18
The stem-and-leaf display below shows the result of a survey on 50 students on their satisfaction
with their school with the higher scores represent higher level of satisfaction.
-True or False: Referring to Scenario 2-18, if a student is randomly selected, his/her most likely
level of satisfaction will be in the 60s among the 40s, 50s, 60s, 70s, 80s and 90s.
(True/False)
4.8/5 (40)
SCENARIO 2-14
The table below contains the number of people who own a portable Blu-ray player in a sample of 600
broken down by gender.
-Referring to Scenario 2-14, construct a table of row percentages.
(Essay)
4.7/5 (25)
True or False: The Guidelines for Developing Visualizations recommend using the simplest
possible visualization.
(True/False)
5.0/5 (34)
Referring to Scenario 2-11, if a frequency distribution for the defects data is constructed, using
"0 but less than 5" as the first class, the relative frequency of the "15 but less than 20" class
would be ________.
(Essay)
5.0/5 (37)
Filters
- Essay(0)
- Multiple Choice(0)
- Short Answer(0)
- True False(0)
- Matching(0)