Exam 2: Organizing and Visualizing
Exam 1: Defining and Collecting Data200 Questions
Exam 2: Organizing and Visualizing189 Questions
Exam 3: Numerical Descriptive Measures80 Questions
Exam 4: Basic Probability108 Questions
Exam 5: Discrete Probability Distributions81 Questions
Exam 6: Conthe Tinuonormausl Disdis Tributionstribution and Other38 Questions
Exam 7: Sampling Distributions62 Questions
Exam 8: Confidence Interval Estimation139 Questions
Exam 9: Fundamentals of Hypothesis Testing: One-Sample Tests133 Questions
Exam 10: Two-Sample Tests95 Questions
Exam 11: Analysis of Variance73 Questions
Exam 12: Chi-Square and Nonparametric100 Questions
Exam 13: Simple Linear Regression89 Questions
Exam 14: Introduction to Multiple113 Questions
Exam 15: Multiple Regression62 Questions
Exam 16: Time-Series Forecasting61 Questions
Exam 17: Business Analytics102 Questions
Exam 18: A Roadmap for Analyzing Data133 Questions
Exam 19: Statistical Applications in Quality Management86 Questions
Exam 20: Decision Making121 Questions
Select questions type
SCENARIO 2-9
The frequency distribution below represents the rents of 250 randomly selected federally subsidized
apartments in a small town. 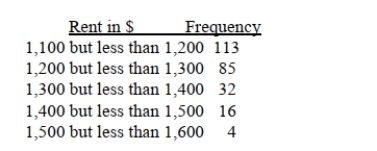 -Referring to Scenario 2-9, ________ apartments rented for at least $1,200 but less than $1,400.
(Essay)
4.9/5  (29)
(29)
True or False: A multidimensional contingency table allows you to tally the responses of more than
two categorical variables.
(True/False)
4.9/5 (34)
SCENARIO 2-12
The table below contains the opinions of a sample of 200 people broken down by gender about the
latest congressional plan to eliminate anti-trust exemptions for professional baseball. 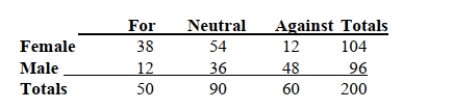 -Referring to Scenario 2-12, ________ percent of the 200 were females who were either neutral
or against the plan.
-Referring to Scenario 2-12, ________ percent of the 200 were females who were either neutral
or against the plan.
(Essay)
4.8/5 (38)
SCENARIO 2-10
The histogram below represents scores achieved by 200 job applicants on a personality profile. 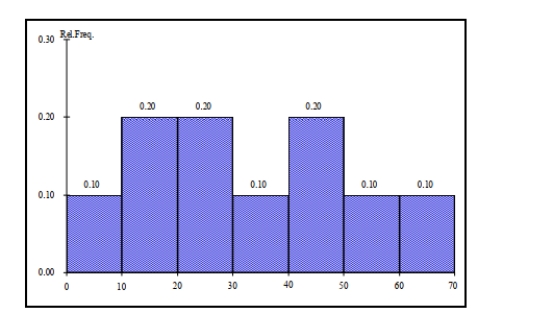 -Referring to the histogram from Scenario 2-10, 90% of the job applicants scored above or equal
to ________.
-Referring to the histogram from Scenario 2-10, 90% of the job applicants scored above or equal
to ________.
(Essay)
4.8/5 (39)
True or False: The sum of cumulative frequencies in a distribution always equals 1.
(True/False)
4.7/5 (39)
True or False: A multidimensional contingency table allows you to tally the responses of more than
two continuous variables.
(True/False)
4.8/5 (32)
Data on the number of credit hours of 20,000 students at a public university enrolled in a Spring
Semester were collected.Which of the following is the best for presenting the information?
(Multiple Choice)
4.9/5 (38)
SCENARIO 2-13
Given below is the stem-and-leaf display representing the amount of detergent used in gallons (with
leaves in 10ths of gallons)in a day by 25 drive-through car wash operations in Phoenix. 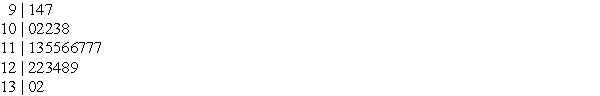 2-36 Organizing and Visualizing Variables
-Referring to Scenario 2-13, if a percentage histogram for the detergent data is constructed,
using "9.0 but less than 10.0 gallons" as the first class, the percentage of drive-through car wash
operations that use "12.0 but less than 13.0 gallons" of detergent would be ________.
2-36 Organizing and Visualizing Variables
-Referring to Scenario 2-13, if a percentage histogram for the detergent data is constructed,
using "9.0 but less than 10.0 gallons" as the first class, the percentage of drive-through car wash
operations that use "12.0 but less than 13.0 gallons" of detergent would be ________.
(Essay)
4.8/5 (37)
SCENARIO 2-9
The frequency distribution below represents the rents of 250 randomly selected federally subsidized
apartments in a small town.
-Referring to Scenario 2-9, ________ percent of the apartments rented for $1,400 or more.
(Essay)
5.0/5 (38)
SCENARIO 2-17
The following table presents total retail sales in millions of dollars for the leading apparel companies
over a two-year period in the past. 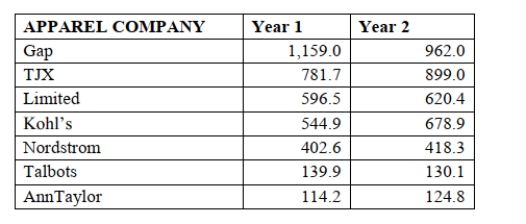 2-46 Organizing and Visualizing Variables
-Referring to Scenario 2-17, construct a side-by-side bar chart.
2-46 Organizing and Visualizing Variables
-Referring to Scenario 2-17, construct a side-by-side bar chart.
(Essay)
4.8/5 (39)
SCENARIO 2-6
A sample of 200 students at a Big-Ten university was taken after the midterm to ask them whether
they went bar hopping the weekend before the midterm or spent the weekend studying, and whether
they did well or poorly on the midterm.The following table contains the result. 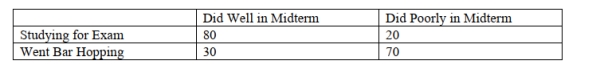 -Referring to Scenario 2-6, _______ percent of the students in the sample went bar hopping the
Weekend before the midterm and did well on the midterm.
-Referring to Scenario 2-6, _______ percent of the students in the sample went bar hopping the
Weekend before the midterm and did well on the midterm.
(Multiple Choice)
4.8/5 (37)
SCENARIO 2-2
At a meeting of information systems officers for regional offices of a national company, a survey was
taken to determine the number of employees the officers supervise in the operation of their
departments, where X is the number of employees overseen by each information systems officer.
X f_
1 7
2 5
3 11
4 8
5 9
-The width of each bar in a histogram corresponds to the
(Multiple Choice)
4.9/5 (32)
SCENARIO 2-12
The table below contains the opinions of a sample of 200 people broken down by gender about the
latest congressional plan to eliminate anti-trust exemptions for professional baseball.
-Referring to Scenario 2-12, _______ percent of the 200 were not neutral.
(Essay)
4.7/5 (41)
SCENARIO 2-10
The histogram below represents scores achieved by 200 job applicants on a personality profile.
-Referring to the histogram from Scenario 2-10, _______ percent of the applicants scored
between 20 and below 50.
(Essay)
4.8/5 (27)
SCENARIO 2-5
The following are the duration in minutes of a sample of long-distance phone calls made within the
continental United States reported by one long-distance carrier. 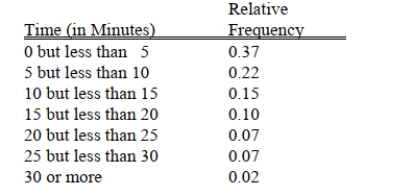 -Referring to Scenario 2-5, if 100 calls were randomly sampled, how many calls lasted 15 minutes
Or longer?
-Referring to Scenario 2-5, if 100 calls were randomly sampled, how many calls lasted 15 minutes
Or longer?
(Multiple Choice)
4.7/5 (47)
True or False: The sum of relative frequencies in a distribution always equals 1.
(True/False)
4.7/5 (37)
SCENARIO 2-16
The figure below is the percentage polygon for the amount of calories for a sample of 36 pizzas
products where the upper limits of the intervals are: 310, 340, 370, 400 and 430.
Percentage Polygon for Calories 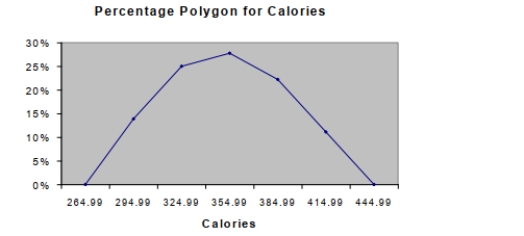 -Referring to Scenario 2-16, roughly what percentage of pizza products contains at least 340
Calories?
-Referring to Scenario 2-16, roughly what percentage of pizza products contains at least 340
Calories?
(Multiple Choice)
4.7/5 (27)
When polygons or histograms are constructed, which axis must show the true zero or "origin"?
(Multiple Choice)
4.8/5 (39)
True or False: Ogives are plotted at the midpoints of the class groupings.
(True/False)
4.9/5 (44)
SCENARIO 2-12
The table below contains the opinions of a sample of 200 people broken down by gender about the
latest congressional plan to eliminate anti-trust exemptions for professional baseball.
-Referring to Scenario 2-12, construct a table of column percentages.
(Essay)
4.8/5 (35)
Filters
- Essay(0)
- Multiple Choice(0)
- Short Answer(0)
- True False(0)
- Matching(0)