Exam 2: Organizing and Visualizing
Exam 1: Defining and Collecting Data200 Questions
Exam 2: Organizing and Visualizing189 Questions
Exam 3: Numerical Descriptive Measures80 Questions
Exam 4: Basic Probability108 Questions
Exam 5: Discrete Probability Distributions81 Questions
Exam 6: Conthe Tinuonormausl Disdis Tributionstribution and Other38 Questions
Exam 7: Sampling Distributions62 Questions
Exam 8: Confidence Interval Estimation139 Questions
Exam 9: Fundamentals of Hypothesis Testing: One-Sample Tests133 Questions
Exam 10: Two-Sample Tests95 Questions
Exam 11: Analysis of Variance73 Questions
Exam 12: Chi-Square and Nonparametric100 Questions
Exam 13: Simple Linear Regression89 Questions
Exam 14: Introduction to Multiple113 Questions
Exam 15: Multiple Regression62 Questions
Exam 16: Time-Series Forecasting61 Questions
Exam 17: Business Analytics102 Questions
Exam 18: A Roadmap for Analyzing Data133 Questions
Exam 19: Statistical Applications in Quality Management86 Questions
Exam 20: Decision Making121 Questions
Select questions type
True or False: The percentage distribution cannot be constructed from the frequency
distribution directly.
(True/False)
4.8/5  (31)
(31)
Data on 1,500 students' height were collected at a larger university in the East Coast.Which of
The following is the best chart for presenting the information?
(Multiple Choice)
4.8/5 (37)
SCENARIO 2-13
Given below is the stem-and-leaf display representing the amount of detergent used in gallons (with
leaves in 10ths of gallons)in a day by 25 drive-through car wash operations in Phoenix. 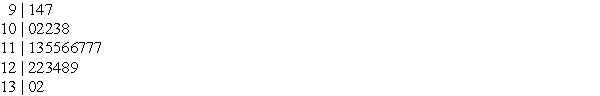 2-36 Organizing and Visualizing Variables
-Referring to Scenario 2-13, construct a cumulative percentage polygon for the detergent data if
the corresponding frequency distribution uses "9.0 but less than 10.0" as the first class.
2-36 Organizing and Visualizing Variables
-Referring to Scenario 2-13, construct a cumulative percentage polygon for the detergent data if
the corresponding frequency distribution uses "9.0 but less than 10.0" as the first class.
(Essay)
4.8/5 (40)
True or False: One of the advantages of a pie chart is that it clearly shows that the total of all
the categories of the pie adds to 100%.
(True/False)
4.8/5 (41)
SCENARIO 2-18
The stem-and-leaf display below shows the result of a survey on 50 students on their satisfaction
with their school with the higher scores represent higher level of satisfaction. 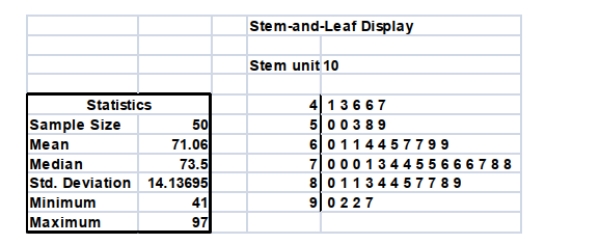 -True or False: Referring to Scenario 2-18, if a student is randomly selected, his/her most likely
level of satisfaction will be in the 70s among the 40s, 50s, 60s, 70s, 80s and 90s.
-True or False: Referring to Scenario 2-18, if a student is randomly selected, his/her most likely
level of satisfaction will be in the 70s among the 40s, 50s, 60s, 70s, 80s and 90s.
(True/False)
4.8/5 (35)
True or False: The relative frequency is the frequency in each class divided by the total number
of observations.
(True/False)
4.7/5 (31)
The width of each class grouping or interval in a frequency distribution should be ________.
(Essay)
4.7/5 (40)
You have collected data on the responses to two questions asked in a survey of 40 college
Students majoring in business-What is your gender (Male = M; Female = F)and What is your
Major (Accountancy = A; Computer Information Systems = C; Marketing = M).Which of the
Following is the best for presenting the data?
(Multiple Choice)
4.9/5 (39)
SCENARIO 2-4
A survey was conducted to determine how people rated the quality of programming available on
television.Respondents were asked to rate the overall quality from 0 (no quality at all)to 100
(extremely good quality).The stem-and-leaf display of the data is shown below. 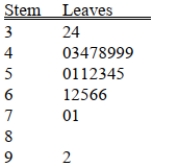 -Referring to Scenario 2-4, what percentage of the respondents rated overall television quality
With a rating from 50 through 75?
-Referring to Scenario 2-4, what percentage of the respondents rated overall television quality
With a rating from 50 through 75?
(Multiple Choice)
4.8/5 (44)
True or False: In general, grouped frequency distributions should have between 5 and 15 class
intervals.
(True/False)
4.8/5 (40)
SCENARIO 2-7 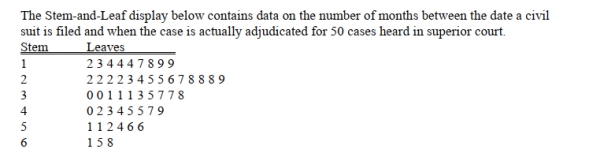 -Referring to Scenario 2-7, the civil suit with the fourth shortest waiting time between when the
suit was filed and when it was adjudicated had a wait of ________ months.
-Referring to Scenario 2-7, the civil suit with the fourth shortest waiting time between when the
suit was filed and when it was adjudicated had a wait of ________ months.
(Essay)
4.8/5 (28)
True or False: Histograms are used for numerical data while bar charts are suitable for
categorical data.
(True/False)
5.0/5 (40)
SCENARIO 2-5
The following are the duration in minutes of a sample of long-distance phone calls made within the
continental United States reported by one long-distance carrier. 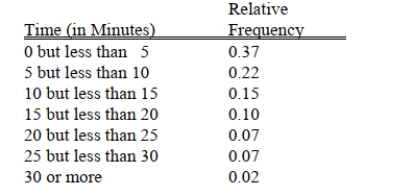 -Referring to Scenario 2-5, if 100 calls were randomly sampled, _______ of them would have
Lasted at least 15 minutes but less than 20 minutes
-Referring to Scenario 2-5, if 100 calls were randomly sampled, _______ of them would have
Lasted at least 15 minutes but less than 20 minutes
(Multiple Choice)
4.8/5 (41)
SCENARIO 2-14
The table below contains the number of people who own a portable Blu-ray player in a sample of 600
broken down by gender. 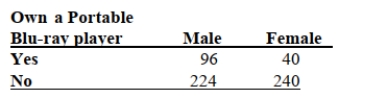 -Referring to Scenario 2-14, construct a table of total percentages.
(Essay)
4.7/5 (31)
A professor of economics at a small Texas university wanted to determine what year in school
Students were taking his tough economics course.Shown below is a pie chart of the results.What
Percentage of the class took the course prior to reaching their senior year? 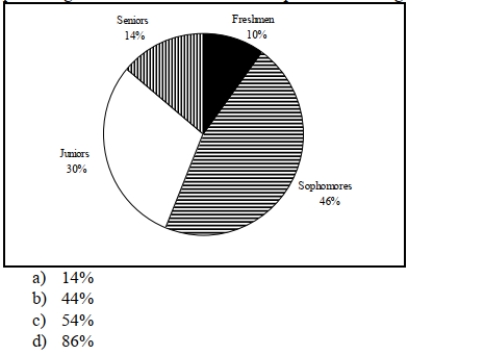
(Multiple Choice)
4.7/5 (38)
In constructing a polygon, each class grouping is represented by its _______ and then these are
consecutively connected to one another.
(Essay)
4.8/5 (31)
True or False: The larger the number of observations in a numerical data set, the larger the
number of class intervals needed for a grouped frequency distribution.
(True/False)
4.8/5 (32)
One of the developing countries is experiencing a baby boom, with the number of births rising
For the fifth year in a row, according to a BBC News report.Which of the following is best for
Displaying this data?
(Multiple Choice)
4.9/5 (36)
To evaluate two categorical variables at the same time, a _______ could be developed.
(Essay)
4.8/5 (41)
When studying the simultaneous responses to two categorical questions, you should set up a
(Multiple Choice)
4.8/5 (36)
Filters
- Essay(0)
- Multiple Choice(0)
- Short Answer(0)
- True False(0)
- Matching(0)