Exam 13: Categorical Data Analysis
Exam 1: Statistics, Data, and Statistical Thinking77 Questions
Exam 2: Methods for Describing Sets of Data187 Questions
Exam 3: Probability284 Questions
Exam 4: Discrete Random Variables134 Questions
Exam 5: Continuous Random Variables138 Questions
Exam 6: Sampling Distributions52 Questions
Exam 7: Inferences Based on a Single Sample: Estimation With Confidence Intervals125 Questions
Exam 8: Inferences Based on a Single144 Questions
Exam 9: Inferences Based on Two Samples: Confidence Intervals and Tests of Hypotheses100 Questions
Exam 10: Analysis of Variance: Comparing More Than Two Means91 Questions
Exam 11: Simple Linear Regression113 Questions
Exam 12: Multiple Regression and Model Building131 Questions
Exam 13: Categorical Data Analysis60 Questions
Exam 14: Nonparametric Statistics Available Online87 Questions
Select questions type
A random sample of 160 car accidents are selected and categorized by the age of the driver determined to be at fault. The results are listed below. The age distribution of drivers for the given categories is for the under 26 group, for the group, for the group, and for the group over 65 . Calculate the chi-square test statistic used to test the claim that all ages have crash rates proportional to their driving rates.
Age Under 26 26-45 46-65 Over 65 Drivers 66 39 25 30
(Multiple Choice)
4.9/5  (30)
(30)
The data below show the age and favorite type of music of 779 randomly selected people. Test the claim that age and preferred music type are independent. Use .
Age Country Rock Pop Classical 15-21 21 45 90 33 21-30 68 55 42 48 30-40 65 47 31 57 40-50 60 39 25 53
(Essay)
4.9/5 (35)
A survey of entrepreneurs focused on their job characteristics, work habits, social activities, leisure time, etc. One question put to each entrepreneur was, ʺWhat make of car (U.S., Europe, or Japan)
Do you drive?ʺ The responses (number in each category)for a sample of 100 entrepreneurs are
Summarized below. The goal of the analysis is to determine if the proportions of entrepreneurs
Who drive American, European, and Japanese cars differ. U.S. Europe Japan 40 35 25
In order to determine whether the true proportions in each response category differ, a one-way chi-square analysis should be conducted. Suppose the p-value for the test was calculated to be . What is the appropriate conclusion to make when testing at ?
(Multiple Choice)
4.7/5 (34)
A sports researcher is interested in determining if there is a relationship between the number of home team and visiting team wins and different sports. A random sample of 526 games is selected and the results are given below. Assuming the row and column classifications are independent, find an estimate for the expected cell count of cell .
Football Basketball Soccer Baseball Home team wins 39 157 27 80 Visiting team wins 29 95 20 79
(Multiple Choice)
4.7/5 (41)
Use the appropriate table to find the following probability: for .
(Multiple Choice)
4.8/5 (34)
A sports researcher is interested in determining if there is a relationship between the number of home team and visiting team wins and different sports. A random sample of 526 games is selected and the results are given below. Calculate the chi-square test statistic used to test the claim that the number of home team and visiting team wins is independent of the sport. Use .
Football Basketball Soccer Baseball Home team wins 39 156 25 83 Visiting team wins 31 98 19 75
(Multiple Choice)
4.8/5 (47)
A business professor conducted a campus survey to estimate demand among all students for a protein supplement for smoothies and other nutritional drinks. Each of 113 students, randomly
Selected from all students on campus, provided the following information: (1) How health conscious are you? (Very, Moderately, Slightly, Not very)
(2) Do you prefer protein supplements in your smoothies? (Yes, No)
As part of his analysis, the professor claims that whether or not the student prefers a protein supplement in smoothies is independent of health consciousness level (Very, Moderate, Slightly, or Not very). Identify the appropriate alternative hypothesis that the professor should use in the test of hypothesis he desires.
(Multiple Choice)
4.9/5 (45)
A coffeehouse wishes to see if customers have any preference among 5 different brands of coffee. A sample of 200 customers provided the data below. Calculate the chi-square test statistic used to test the claim that the probabilities show no preference.
Brand 1 2 3 4 5 Customers 55 65 18 30 32
(Multiple Choice)
4.9/5 (38)
A new coffeehouse wishes to see whether customers have any preference among 5 different brands of coffee. A sample of 200 customers provided the data below. Test the claim that the probabilities show no preference. Use .
Brand 1 2 3 4 5 Customers 30 55 32 65 18
(Essay)
4.9/5 (36)
A multinomial experiment with k = 3 cells and n =100 has been conducted and the results
are shown in the table.  Construct a 99% confidence interval for the multinomial probability associated with cell 2.
(Essay)
4.8/5 (39)
A drug company developed a honey-based liquid medicine designed to calm a childʹs cough at night. To test the drug, 105 children who were ill with an upper respiratory tract infection were
Randomly selected to participate in a clinical trial. The children were randomly divided into three
Groups - one group was given a dosage of the honey drug, the second was given a dosage of
Liquid DM (an over-the-counter cough medicine), and the third (control group)received a liquid
Placebo (no dosage at all). After administering the medicine to their coughing child, parents rated
Their childrenʹs cough diagnosis as either better or worse. The results are shown in the table below: 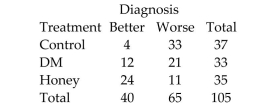 In order to determine whether the treatment group is independent of the coughing diagnosis, a two-way chi-square test was conducted. Calculate the value of the test statistic for the desired analysis.
(Multiple Choice)
4.9/5 (38)
A multinomial experiment with k = 4 cells and n = 400 produced the data shown in the following table. 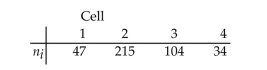 Previous studies in this area have shown that . Construct a confidence interval for the multinomial probability associated with cell
(Multiple Choice)
4.9/5 (32)
Inc. Technology reported the results of consumer survey in which 300 Internet users indicated their level of agreement with the following statement: ʺThe government needs to be able to scan
Internet messages and user communications to prevent fraud and other crimes.ʺ The possible
Responses were ʺagree stronglyʺ, ʺagree somewhatʺ, ʺdisagree somewhatʺ, and ʺdisagree stronglyʺ.
The number of Internet users in each category is summarized in the table. RESPONSE NUMBER Agree Strongly 60 Agree Somewhat 110 Disagree Somewhat 80 Disagree Strongly 50
In order to determine whether the true proportions of Internet users in each response category differ, a one-way chi-square analysis should be conducted. Use the chi-square distribution to determine the rejection region when testing at .
(Multiple Choice)
5.0/5 (37)
Find the rejection region for a test of independence of two classifications where the contingency table contains rows and columns and .
(Multiple Choice)
4.8/5 (37)
The null hypothesis for a test of data resulting from a multinomial experiment is given as . What is the alternative hypothesis for the test?
(Essay)
4.8/5 (35)
Economists at USF are researching the problem of absenteeism at U.S. firms. A random sample of 100 U.S. organizations was selected to participate in a 1-year study. As part of the study, the
Economists had collected data on the following two variables for each company: shiftwork
Available (Yes or No), and union-management relationship (Good or Poor). As part of their
Analyses, the economists wanted to determine whether or not a company makes shiftwork
Available depends on the relationship between union and management. The collected data are
Shown below: Relation
Shiftwork Good Bad Total No 11 22 33 Yes 25 42 67 Total 36 64 100
In order to determine whether the shiftwork responses depend on the relationship responses, a two-way chi-square analysis should be conducted. When calculating the test statistic, what values for the expected counts should be used in the calculation?
(Multiple Choice)
4.7/5 (42)
A teacher finds that final grades in the statistics department are distributed as: A, 25\%; B, ; D, 5\%; F, 5\%. At the end of a randomly selected semester, the following grades were recorded. Determine if the grade distribution for the department is different than expected. Use .
Grade A B C D F Number 36 42 60 8 14
(Essay)
4.9/5 (34)
Economists at USF are researching the problem of absenteeism at U.S. firms. A random sample of 100 U.S. organizations was selected to participate in a 1-year study. As part of the study, the
Economists had collected data on the following two variables for each company: shiftwork
Available (Yes or No), and union-management relationship (Good or Poor). As part of their
Analyses, the economists wanted to determine whether or not a company makes shiftwork
Available depends on the relationship between union and management. The collected data are
Shown below: 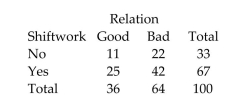 Use the chi-square distribution to determine the rejection region for this test when testing at .
(Multiple Choice)
4.9/5 (39)
Economists at USF are researching the problem of absenteeism at U.S. firms. A random sample of 100 U.S. organizations was selected to participate in a 1-year study. As part of the study, the
Economists had collected data on the following two variables for each company: shiftwork
Available (Yes or No), and union-management relationship (Good or Poor). As part of their
Analyses, the economists wanted to determine whether or not a company makes shiftwork
Available depends on the relationship between union and management. The collected data are
Shown below: Relation
Shiftwork Good Bad Total No 11 22 33 Yes 25 42 67 Total 36 64 100
In order to determine whether the shiftwork responses depend on the relationship responses, a two-way chi-square analysis should be conducted. Calculate the value of the test statistic for the desired analysis.
(Multiple Choice)
4.8/5 (36)
A survey of entrepreneurs focused on their job characteristics, work habits, social activities, leisure time, etc. One question put to each entrepreneur was, ʺWhat make of car (U.S., Europe, or Japan)
Do you drive?ʺ The responses (number in each category)for a sample of 100 entrepreneurs are
Summarized below. The goal of the analysis is to determine if the proportions of entrepreneurs
Who drive American, European, and Japanese cars differ. U.S. Europe Japan 40 35 25
In order to determine whether the true proportions in each response category differ, a one-way chi-square analysis should be conducted. Use the chi-square distribution to determine the rejection region when testing at .
(Multiple Choice)
4.8/5 (38)
Filters
- Essay(0)
- Multiple Choice(0)
- Short Answer(0)
- True False(0)
- Matching(0)