Exam 13: Categorical Data Analysis
Exam 1: Statistics, Data, and Statistical Thinking77 Questions
Exam 2: Methods for Describing Sets of Data187 Questions
Exam 3: Probability284 Questions
Exam 4: Discrete Random Variables134 Questions
Exam 5: Continuous Random Variables138 Questions
Exam 6: Sampling Distributions52 Questions
Exam 7: Inferences Based on a Single Sample: Estimation With Confidence Intervals125 Questions
Exam 8: Inferences Based on a Single144 Questions
Exam 9: Inferences Based on Two Samples: Confidence Intervals and Tests of Hypotheses100 Questions
Exam 10: Analysis of Variance: Comparing More Than Two Means91 Questions
Exam 11: Simple Linear Regression113 Questions
Exam 12: Multiple Regression and Model Building131 Questions
Exam 13: Categorical Data Analysis60 Questions
Exam 14: Nonparametric Statistics Available Online87 Questions
Select questions type
A drug company developed a honey-based liquid medicine designed to calm a childʹs cough at night. To test the drug, 105 children who were ill with an upper respiratory tract infection were
Randomly selected to participate in a clinical trial. The children were randomly divided into three
Groups - one group was given a dosage of the honey drug, the second was given a dosage of
Liquid DM (an over-the-counter cough medicine), and the third (control group)received a liquid
Placebo (no dosage at all). After administering the medicine to their coughing child, parents rated
Their childrenʹs cough diagnosis as either better or worse. The results are shown in the table below: 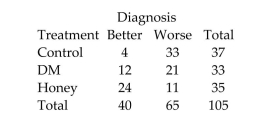 In order to determine whether the treatment group is independent of the coughing diagnosis, a two-way chi-square test was conducted. Suppose the p-value for the test was calculated to be . What is the appropriate conclusion to make when testing at ?
(Multiple Choice)
4.7/5  (39)
(39)
A random sample of 160 car accidents are selected and categorized by the age of the driver determined to be at fault. The results are listed below. The age distribution of drivers for the given categories is for the under 26 group, for the group, for the group, and for the group over 65 . Find the rejection region used to test the claim that all ages have crash rates proportional to their number of drivers. Use .
Age Under 26 26-45 46-65 Over 65 Drivers 66 39 25 30
(Multiple Choice)
4.8/5 (32)
A survey of entrepreneurs focused on their job characteristics, work habits, social activities, leisure time, etc. One question put to each entrepreneur was, ʺWhat make of car (U.S., Europe, or Japan)
Do you drive?ʺ The responses (number in each category)for a sample of 100 entrepreneurs are
Summarized below. The goal of the analysis is to determine if the proportions of entrepreneurs
Who drive American, European, and Japanese cars differ. U.S. Europe Japan 40 35 25
In order to determine whether the true proportions in each response category differ, a one-way chi-square analysis should be conducted. As part of that analysis, a confidence interval for the multinomial probability associated with the "Europe" response was desired. Which of the following confidence intervals should be used?
(Multiple Choice)
4.8/5 (27)
Inc. Technology reported the results of consumer survey in which 300 Internet users indicated their level of agreement with the following statement: ʺThe government needs to be able to scan
Internet messages and user communications to prevent fraud and other crimes.ʺ The possible
Responses were ʺagree stronglyʺ, ʺagree somewhatʺ, ʺdisagree somewhatʺ, and ʺdisagree stronglyʺ.
The number of Internet users in each category is summarized in the table. RESPONSE NUMBER Agree Strongly 60 Agree Somewhat 110 Disagree Somewhat 80 Disagree Strongly 50
In order to determine whether the true proportions of Internet users in each response category differ, a one-way chi-square analysis should be conducted. As part of that analysis, a confidence interval for the multinomial probability associated with the "Disagree Somewhat" response was desired. Which of the following confidence intervals should be used?
(Multiple Choice)
4.9/5 (32)
A multinomial experiment with k = 4 cells and n = 300 produced the data shown in the
following table. 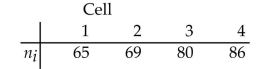 Do these data provide sufficient evidence to contradict the null hypothesis that , and ? Test using .
(Essay)
4.8/5 (34)
A drug company developed a honey-based liquid medicine designed to calm a childʹs cough at night. To test the drug, 105 children who were ill with an upper respiratory tract infection were
Randomly selected to participate in a clinical trial. The children were randomly divided into three
Groups - one group was given a dosage of the honey drug, the second was given a dosage of
Liquid DM (an over-the-counter cough medicine), and the third (control group)received a liquid
Placebo (no dosage at all). After administering the medicine to their coughing child, parents rated
Their childrenʹs cough diagnosis as either better or worse. The results are shown in the table below: 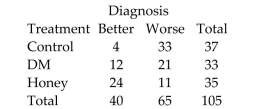 In order to determine whether the treatment group is independent of the coughing diagnosis, a two-way chi-square test was conducted. Use the chi-square distribution to determine the rejection region for this test when testing at .
(Multiple Choice)
4.8/5 (42)
A teacher finds that final grades in the statistics department are distributed as: A, 25\%; B, 25\%; C, ; D, 5\%; F, 5\%. At the end of a randomly selected semester, the following grades were recorded. Calculate the chi-square test statistic used to determine if the grade distribution for the department is different than expected. Use .
Grade A B C D F Number 42 36 60 14 8
(Multiple Choice)
4.8/5 (39)
When using any procedure to perform a hypothesis test, the user should always be certain that the
experiment satisfies the assumptions given with the procedure.
(True/False)
4.7/5 (31)
A professor chose a random sample of 50 recent graduates of an MBA program and
recorded the gender of each graduate (M or
F)and whether the graduate chose to
complete his or her degree requirements by completing a research project (RP)or by
taking comprehensive exams (CE). The results are shown below.
M, CE M, RP F, RP M, CE M, CE F, CE F, RP, M, CE M, RP F, RP F, CE M, RP F, RP F, CE M, RP F, RP M, RP F, CE M, CE M, CE M, RP F, CE F, RP M, CE M, CE F, CE M, RP F, RP M, CE M, CE F, CE F, RP, M, CE M, RP F, RP M, CE M, RP F, RP F, CE M, RP F, RP M, RP M, CE M, CE M, CE M, RP F, CE F, RP M, CE F, CE
a. Create a contingency table for the data.
b. Perform a -test to determine if there is any evidence that gender and choice of research project or comprehensive exams are not independent. Use .
(Essay)
5.0/5 (29)
Many track runners believe that they have a better chance of winning if they start in the inside lane that is closest to the field. For the data below, the lane closest to the field is Lane 1, the next lane is
Lane 2, and so on until the outermost lane, Lane 6. The table displays the starting positions for the
Winnners of 240 competitions. Calculate the chi-square test statistic used to test the claim that
The probability of winning is the same regardless of starting position.. Starting Position 1 2 3 4 5 6 Number of Wins 44 33 36 45 32 50
(Multiple Choice)
4.8/5 (39)
An adverse drug effect (ADE)is an unintended injury caused by prescribed medication. The table summarizes the proximal cause of 95 ADEs that resulted from a dosing error at a Boston hospital. WRONG DOSAGE USE NUMBER OF ADEs (1) Lack of knowledge of drug 29 (2) Rule violation 17 (3) Faulty dose checking 13 (4) Slips 9 (5) Other 27 TOTAL 95
In order to determine whether the true percentages of ADEs in the five "cause" categories differ, a chi-square analysis was conducted. Use the chi-square distribution to determine rejection region when testing at .
(Multiple Choice)
4.8/5 (29)
Inc. Technology reported the results of consumer survey in which 300 Internet users indicated their level of agreement with the following statement: ʺThe government needs to be able to scan
Internet messages and user communications to prevent fraud and other crimes.ʺ The possible
Responses were ʺagree stronglyʺ, ʺagree somewhatʺ, ʺdisagree somewhatʺ, and ʺdisagree stronglyʺ.
The number of Internet users in each category is summarized in the table. RESPONSE NUMBER Agree Strongly 60 Agree Somewhat 110 Disagree Somewhat 80 Disagree Strongly 50 In order to determine whether the true proportions of Internet users in each response category
Differ, a one-way chi-square analysis should be conducted. Which of the following statements is
Not necessary for the analysis to be valid?
(Multiple Choice)
5.0/5 (25)
Consider the accompanying contingency table. Column Row 1 2 3 1 13 15 16 2 19 26 11
a. Convert the values in row 1 to percentages by calculating the percentage of each column total falling in row
b. Create a bar graph with row 1 percentage on the vertical axis and column number on the horizontal axis.
c. What pattern do you expect to see if the rows and columns are not independent? Is this pattern present in your graph?
(Essay)
4.9/5 (34)
Many track runners believe that they have a better chance of winning if they start in the inside lane that is closest to the field. For the data below, the lane closest to the field is Lane 1, the next lane is Lane 2, and so on until the outermost lane, Lane 6 . The table displays the starting positions for the winners of 240 competitions. Find the rejection region used to test the claim that the probability of winning is the same regardless of starting position. Use . The results are based on 240 wins.
Starting Position 1 2 3 4 5 6 Number of Wins 33 50 32 44 45 36
(Multiple Choice)
4.7/5 (25)
The contingency table below shows the results of a random sample of 200 state representatives that was conducted to see whether their opinions on a bill are related to their party affiliations. Use .
Opinion Party Approve Disapprove No Opinion Republican 42 20 14 Democrat 50 24 18 Independent 10 16 6
Find the rejection region used to test the claim of independence.
(Multiple Choice)
4.8/5 (44)
Many track runners believe that they have a better chance of winning if they start in the inside lane that is closest to the field. For the data below, the lane closest to the field is Lane 1, the next lane is Lane 2, and so on until the outermost lane, Lane 6. The table displays the starting positions for the winners of 240 competitions. Test the claim that the probability of winning is the same regardless of starting position. Use . The results are based on 240 wins.
Starting Position 1 2 3 4 5 6 Number of Wins 33 45 50 44 36 32
(Essay)
4.7/5 (40)
A sports researcher is interested in determining if there is a relationship between the number of home team and visiting team wins and different sports. A random sample of 526 games is selected and the results are given below. Test the claim that the number of home team and visiting team wins is independent of the sport. Use .
Football Basketball Soccer Baseball Home team wins 39 156 25 83 Visiting team wins 31 98 19 75
(Essay)
4.8/5 (35)
A business professor conducted a campus survey to estimate demand among all students for a protein supplement for smoothies and other nutritional drinks. Each of 113 students, randomly
Selected from all students on campus, provided the following information: (1) How health conscious are you? (Very, Moderately, Slightly, Not very)
(2) Do you prefer protein supplements in your smoothies? (Yes, No)
As part of his analysis, the professor claims that whether or not the student prefers a protein supplement in smoothies is independent of health consciousness level (Very, Moderate, Slightly, or Not very). Use the chi-square distribution to determine the rejection region for this test when testing at .
(Multiple Choice)
4.8/5 (35)
A survey of entrepreneurs focused on their job characteristics, work habits, social activities, leisure time, etc. One question put to each entrepreneur was, ʺWhat make of car (U.S., Europe, or Japan)
Do you drive?ʺ The responses (number in each category)for a sample of 100 entrepreneurs are
Summarized below. The goal of the analysis is to determine if the proportions of entrepreneurs
Who drive American, European, and Japanese cars differ. U.S. Europe Japan 40 35 25
In order to determine whether the true proportions in each response category differ, a one-way chi-square analysis should be conducted. When calculating the test statistic, what values for the expected counts should be used in the calculation?
(Multiple Choice)
4.7/5 (37)
Filters
- Essay(0)
- Multiple Choice(0)
- Short Answer(0)
- True False(0)
- Matching(0)