Exam 6: Accessing Associations Between Variables
A coffee house owner knows that customers pour different amounts of coffee into their cups. She
Samples cups from 10 costumers she believes to be representative of the customers and weighs the
Cups, finding a mean of 12.5 ounces and standard deviation of 0.5 ounces. Assuming these cups of
Coffee can be considered a random sample of all cups of coffee which of the following formulas
Gives a 95% confidence interval for the mean weight of all cups of coffee?
B
A San Jose State student collects data from 20 students. He compares the number of classes a student is enrolled in to their
GPA. Here are the results of the regression analysis. The conditions for inference are satisfied. 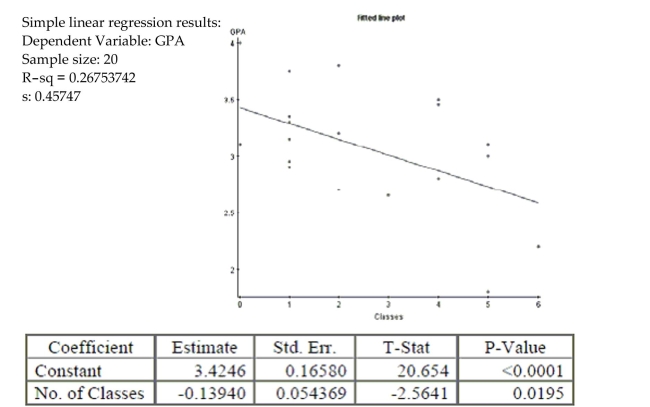 -Is there evidence of a significant relationship between number of classes and GPA? Provide
statistical justification for your answer.
-Is there evidence of a significant relationship between number of classes and GPA? Provide
statistical justification for your answer.
There is no evidence of a linear relationship between number of classes and GPA.
There is evidence of a linear relationship between number of classes and GPA.
The conditions for inference have been met.
With a p-value of , I reject . We have statistically significantly evidence that there is a linear relationship between number of classes and GPA.
In the study "The Role of Sports as a Social Determinant for Children," student respondents in
grades 4 through 6 were asked what they would most like to do at school: make good
grades, be popular or be good at sports. Results delineated by type of school district are
reported below. Rural Suburban Urban Make Good Grades 57 87 24 Be Popular 50 42 6 Be Good at Sports 42 22 5
Source: Chase, M.A and Dummer, G.M. (1992), "The Role of Sports as a Social Determinant for
Children," Research Quarterly for Exercise and Sport, 63, 418-424.
Is there evidence that type of school district and personal school goals are independent?
Test an appropriate hypothesis. Give Statistical evidence to support your conclusion.
: Type of school district and personal school goal are independent.
: There is an association between type of school district and personal school goal.
Conditions:
*Counted Data: We have counts of the number of students in each category.
Randomization: It is given that the sample was randomly selected.
*Expected Cell Frequency: All expected counts are greater than 5 (shown in parenthesis in the table below), so this condition is satisfied.
Under these conditions, the sampling distribution of the test statistic is with
degrees of freedom, and we will perform a test of independence.
The -value is .
With this very small -value, we have sufficient evidence to reject the null hypothesis that school district type and personal school goals are independent
variables. The data provide sufficient evidence to support an association between school district type and personal school goal. Students in rural school are much less likely to be concerned with good grades and much more likely to be concerned with being good at sports.
A contact lens wearer read that the producer of a new contact lens boasts that their lenses are
Cheaper than contact lenses from another popular company. She collected some data, then tested
The null hypothesis
0) Which of the
Following would be a Type II error?
Trainers need to estimate the level of fat in athletes to ensure good health. Initial tests were based
On a small sample but now the trainers double the sample size for a followup test. The main
Purpose of the larger sample is to…
Based on data from two very large independent samples, two students tested a hypothesis about
Equality of population means using
5) One student used a one-tail test and rejected the null
Hypothesis, but the other used a two-tail test and failed to reject the null. Which of these might
Have been their calculated value of t?
Which of the following statements is NOT an assumption of inference for a regression model?
A random sample of 76 apartments is collected near a university. All of the apartments in
the sample have between 1 and 6 bedrooms. The variables recorded for each apartment are
Rent (in dollars) and the number of Bedrooms. The regression output is: The dependent variable is Rent
R squared squared (adjusted) with degrees of freedom
\begin{tabular} { l c c r r }
\multicolumn{1}{c} { Variable } & Coeff & SE(Coeff) & t-ratio & p-value \\
Constant & & & & \\
Bedrooms & & & &
\end{tabular}
a. Write out the regression equation.
b. Compute a 95% confidence interval for the coefficient of Bedrooms. Explain your
confidence interval in the context of the problem.
c. Based on your interval is the number of bedrooms a significant predictor of rent? Explain
how you reached your answer.
d. Explain the meaning of the regression intercept in the context of this problem.
e. Use the plots below to check the regression conditions. 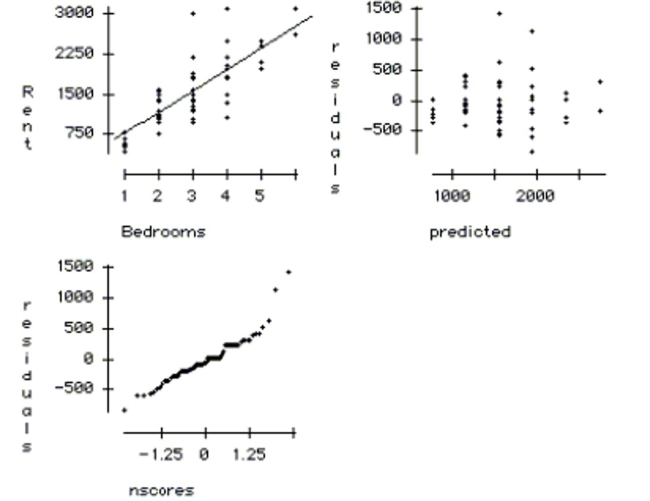
Peanut M&Ms According to the Mars Candy Company, peanut M&M's are 12% brown,
15% yellow, 12% red, 23% blue, 23% orange, and 15% green. On a Saturday when you have
run out of statistics homework, you decide to test this claim. You purchase a medium bag
of peanut M&M's and find 39 browns, 44 yellows, 36 red, 78 blue, 73 orange, and 48 greens.
Test an appropriate hypothesis and state your conclusion.
A philosophy professor wants to find out whether the mean age of the men in his large lecture class is equal to the mean age of the women in his classes. After collecting data from a random sample of his students, the professor tested the hypothesis against the alternative . The -value for the test was . Which is true?
A San Jose State student collects data from 20 students. He compares the number of classes a student is enrolled in to their
GPA. Here are the results of the regression analysis. The conditions for inference are satisfied. Simple linear regression results:
Frted bo poot
Dependent Variable:
Sample size: 20
s:
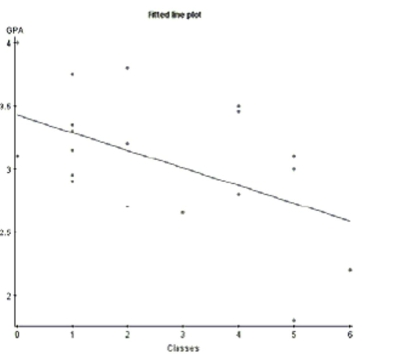
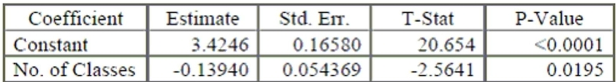 -What is the correlation coefficient for this relationship? Interpret this result in context.
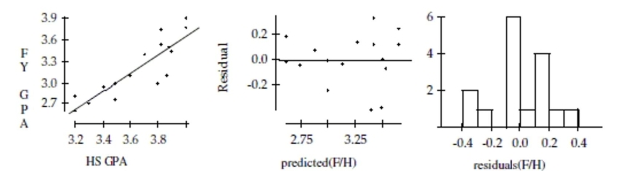
A college admissions counselor was interested in finding out how well high school grade point averages (HS GPA) predict
first-year college GPAs (FY GPA). A random sample of data from first-year students was reviewed to obtain high school and
first-year college GPAs. The data are shown below: HS GPA 3.82 3.90 3.20 3.40 3.88 3.50 3.60 3.70 FY GPA 3.75 3.45 2.60 2.95 3.50 2.76 3.10 3.40
HS GPA 4.00 3.30 3.50 3.80 3.87 4.00 3.20 3.82 FY GPA 3.90 2.70 3.00 3.00 3.10 3.77 2.80 3.54
Dependent variable is: FY GPA
No Selector
R squared R squared (adjusted)
with degrees of freedom
Source Sum of Squares df Mean Square F-ratio Regression 1.92283 1 1.92283 42.9 Residual 0.627867 14 0.044848
Variable Coefficient s.e. of Coeft t-ratio prob Constant -1.56410 0.7306 -2.14 0.0504 HS GPA 1.30527 0.1993 6.55 \leq20.0001
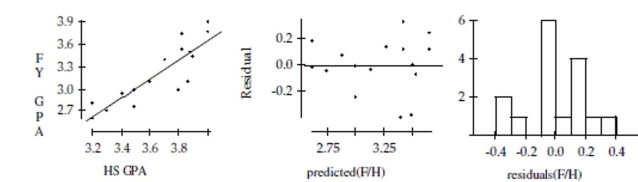 -Create and interpret a 95% confidence interval for the slope of the regression line.
Haircuts You need to find a new hair stylist and know that there are two terrific salons in
your area, Hair by Charles and Curl Up & Dye. You want a really good haircut, but you do
not want to pay too much for the cut. A random sample of costs for 10 different stylists was
taken at each salon (each salon employs over 100 stylists).
a. Indicate what inference procedure you would use to see if there is a significant
difference in the costs for haircuts at each salon. Check the appropriate assumptions and
conditions and indicate whether you could or could nor proceed. (Do not do the actual
test.)
b. A friend tells you that he has heard that Curl Up & Dye is the more expensive salon.
i. Write hypotheses for your friend's claim.
ii. The following are computer outputs. Which output is the correct one to use for this
test? Explain. 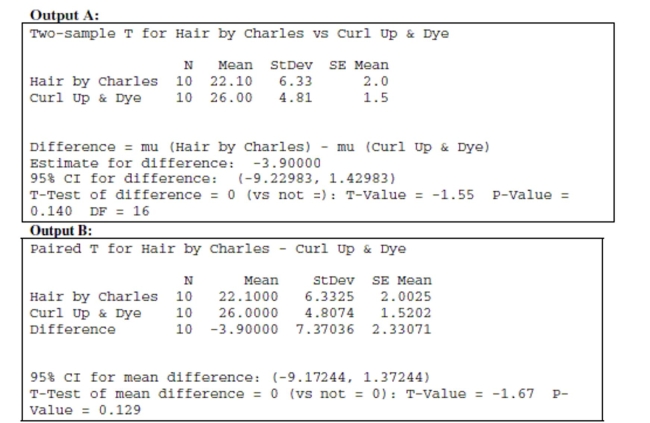 iii. Use the appropriate computer output to make a conclusion about the hypothesis
test based on the data. Make sure to state your conclusion in context.
iii. Use the appropriate computer output to make a conclusion about the hypothesis
test based on the data. Make sure to state your conclusion in context.
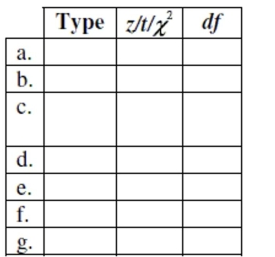
Test identification Suppose you were asked to analyze each of the situations described below.
(NOTE: Do not do these problems!) For each, indicate which procedure you would use (pick the appropriate number from the list), the test statistic ( , , or "chi-squared"), and, if or , the number of degrees of freedom. A choice may be used more than once.
 1. proportion - 1 sample
2. difference of proportions - 2 samples
3. mean - 1 sample
4. difference of means - independent samples
5. mean of differences - matched pairs
6. goodness of fit
7. homogeneity
8. independence
a. A union organization would like to represent the employees at the local market. A
sample of the employees revealed 74 of 120 were in favor of the union. Does the union
have the required 3 to 2 majority?
b. An oral surgeon is interested in estimating how long it takes to extract all four wisdom
teeth. The doctor records the times for 24 randomly chosen surgeries. Estimate the time it
takes to perform the surgery with a 95% confidence interval.
c. A microwave manufacturing company receives large shipments of thermal shields from
two suppliers. A sample from each supplier's shipment is selected and tested for the rate of
defects. The microwave manufacturing company's contract with each supplier states the
shipment with the smallest rate of defect will be accepted. Do the shipments' defect rates
vary from each other?
d. The owner of a construction company would like to know if his current work teams can
build room additions quicker than the time allotted for by the contract. A random sample
of 15 room additions completed recently revealed an average completion time of 0.32 days
faster than contracted. Is this strong evidence that the teams can complete room additions
in less than the contract times?
e. A farmer would like to know if a new fertilizer increases his crop yield. In an effort to
decide this, the farmer recorded the yield for 10 different fields prior to adding fertilizer
and after adding the fertilizer. The farmer assumes the crop yields are approximately
normal. Does the fertilizer work as advertised?
f. A manufacturer gets parts from four suppliers (call them A, B, C, and D). A random
sample of 1000 parts is selected from shipments by each supplier. In the samples, Supplier
A has 21 defects, Supplier B has 14 defects, Supplier C has 8 defects, and Supplier D has 17
defects. Does this suggest any difference between the quality of parts provided by these
suppliers?
g. In a study to determine whether there is a difference between the average jail time
convicted bank robbers and car thieves are sentenced to, the law students randomly
selected 20 cases of each type that resulted in jail sentences during the previous year. A
90% confidence interval was created from the results..
1. proportion - 1 sample
2. difference of proportions - 2 samples
3. mean - 1 sample
4. difference of means - independent samples
5. mean of differences - matched pairs
6. goodness of fit
7. homogeneity
8. independence
a. A union organization would like to represent the employees at the local market. A
sample of the employees revealed 74 of 120 were in favor of the union. Does the union
have the required 3 to 2 majority?
b. An oral surgeon is interested in estimating how long it takes to extract all four wisdom
teeth. The doctor records the times for 24 randomly chosen surgeries. Estimate the time it
takes to perform the surgery with a 95% confidence interval.
c. A microwave manufacturing company receives large shipments of thermal shields from
two suppliers. A sample from each supplier's shipment is selected and tested for the rate of
defects. The microwave manufacturing company's contract with each supplier states the
shipment with the smallest rate of defect will be accepted. Do the shipments' defect rates
vary from each other?
d. The owner of a construction company would like to know if his current work teams can
build room additions quicker than the time allotted for by the contract. A random sample
of 15 room additions completed recently revealed an average completion time of 0.32 days
faster than contracted. Is this strong evidence that the teams can complete room additions
in less than the contract times?
e. A farmer would like to know if a new fertilizer increases his crop yield. In an effort to
decide this, the farmer recorded the yield for 10 different fields prior to adding fertilizer
and after adding the fertilizer. The farmer assumes the crop yields are approximately
normal. Does the fertilizer work as advertised?
f. A manufacturer gets parts from four suppliers (call them A, B, C, and D). A random
sample of 1000 parts is selected from shipments by each supplier. In the samples, Supplier
A has 21 defects, Supplier B has 14 defects, Supplier C has 8 defects, and Supplier D has 17
defects. Does this suggest any difference between the quality of parts provided by these
suppliers?
g. In a study to determine whether there is a difference between the average jail time
convicted bank robbers and car thieves are sentenced to, the law students randomly
selected 20 cases of each type that resulted in jail sentences during the previous year. A
90% confidence interval was created from the results..
Improving productivity A packing company considers hiring a national training
consultant in hopes of improving productivity on the packing line. The national consultant
agrees to work with 18 employees for one week as part of a trial before the packing
company makes a decision about the training program. The training program will be
implemented if the average product packed increases by more than 10 cases per day per
employee. The packing company manager will test a hypothesis using α = 0.05.
a. Write appropriate hypotheses (in words and in symbols).
b. In this context, which do you consider to be more serious - a Type I or a Type II error?
Explain briefly.
c. After this trial produced inconclusive results the manager decided to test the training
program again with another group of employees. Describe two changes he could make in
the trial to increase the power of the test, and explain the disadvantages of each.
AP Grading Every year Educational Testing Services (ETS) selects graders for the
Advanced Placement (AP) Exams. Recently the AP Statistics exam has been graded in
Lincoln, Nebraska. One objective of ETS is to have consistent grading by inviting graders
from all over the nation. However travel expenses are an issue. The accountants at ETS
wonder if the flight costs from cities west of Lincoln are the same as flight costs from cities
east of Lincoln. A random sample of the expense vouchers from last year was reviewed for
the cost of airline tickets. The data are shown in the table below. Indicate what inference
procedure you would use to see if there is a significant difference in the costs of airline
flights to Lincoln from the west and from the east, then decide if it is okay to actually
perform that inference procedure.
(Check the appropriate assumptions and conditions and indicate whether you could or
could not proceed. You do not have to do the actual test.) Cost from east Costs from west 265 257 298 320 340 295 219 288 199 366 398 275 359 430 309 397 105 253 253 366
A company checking the productivity of its assembly line monitored a random sample of workers
For several days. They found that a 95% confidence interval for the mean number of items
Produced daily by each worker was (23,27). Which is true?
As part of a survey, students in a large statistics class were asked whether or not they ate
breakfast that morning. The data appears in the following table: 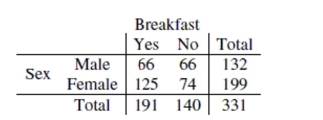 Is there evidence that eating breakfast is independent of the student's sex? Test an
appropriate hypothesis. Give statistical evidence to support your conclusion.
Is there evidence that eating breakfast is independent of the student's sex? Test an
appropriate hypothesis. Give statistical evidence to support your conclusion.
A college admissions counselor was interested in finding out how well high school grade point averages (HS GPA) predict
first-year college GPAs (FY GPA). A random sample of data from first-year students was reviewed to obtain high school and
first-year college GPAs. The data are shown below: HS GPA 3.82 3.90 3.20 3.40 3.88 3.50 3.60 3.70 FY GPA 3.75 3.45 2.60 2.95 3.50 2.76 3.10 3.40
HS GPA 4.00 3.30 3.50 3.80 3.87 4.00 3.20 3.82 FY GPA 3.90 2.70 3.00 3.00 3.10 3.77 2.80 3.54
Dependent variable is: FY GPA
No Selector
R squared R squared (adjusted)
with degrees of freedom
Source Sum of Squares df Mean Square F-ratio Regression 1.92283 1 1.92283 42.9 Residual 0.627867 14 0.044848
Variable Coefficient s.e. of Coeff t-ratio prob Constant -1.56410 0.7306 -2.14 0.0504 HS GPA 1.30527 0.1993 6.55 \leq20.0001
 -Is there evidence of an association between high school and first-year college GPAs? Test
an appropriate hypothesis and state your conclusion in the proper context.
-Is there evidence of an association between high school and first-year college GPAs? Test
an appropriate hypothesis and state your conclusion in the proper context.
Before you took this course, you probably heard many stories about Statistics courses. Oftentimes parents of students have
had bad experiences with Statistics courses and pass on their anxieties to their children. To test whether actually taking
Statistics decreases students' anxieties about Statistics, a Statistics instructor gave a test to rate student anxiety at the
beginning and end of his course. Anxiety levels were measured on a scale of 0-10. Here are the data for 16 randomly chosen
students from a class of 180 students: Pre-course anxiety level 7 6 9 5 6 7 5 7 6 4 3 2 1 3 4 2 Post-course anxiety level 4 3 7 3 4 5 4 6 5 3 2 2 1 3 4 3 Difference (Post - Pre) -3 -3 -2 -2 -2 -2 -1 -1 -1 -1 -1 0 0 0 0 1
-Create and interpret a 90% confidence interval.
Filters
- Essay(0)
- Multiple Choice(0)
- Short Answer(0)
- True False(0)
- Matching(0)