Exam 1: Exploring and Understanding Data
Exam 1: Exploring and Understanding Data125 Questions
Exam 2: Exploring Relationships Between Variables165 Questions
Exam 3: Gathering Data111 Questions
Exam 4: Randomness and Probability148 Questions
Exam 5: From the Data at Hand to the World at Large128 Questions
Exam 6: Accessing Associations Between Variables93 Questions
Exam 7: Inference When Variables Are Related25 Questions
Exam 8: Regression, Associations, and Predictive Modeling792 Questions
Select questions type
Which type of plot would be least likely to reveal that a distribution is bimodal?
Free
(Multiple Choice)
4.8/5  (35)
(35)
Correct Answer: Verified
D
Although most of us buy milk by the quart or gallon, farmers measure daily production in
pounds. Guernsey cows average 39 pounds of milk a day with a standard deviation of 8
pounds. For Jerseys the mean daily production is 43 pounds with a standard deviation of 5
pounds. When being shown at a state fair a champion Guernsey and a champion Jersey
each gave 54 pounds of milk. Which cow's milk production was more remarkable?
Explain.
Free
(Essay)
4.8/5 (31)
Correct Answer:Verified
The Jersey's milk production was comparatively higher. That cow gave slightly more than 2 standard deviations above the average amount of milk , while the Guernsey gave less than 2 standard deviations more than the average for Guernseys ( .
In November 2003 Discover published an article on the colonies of ants. They reported some basic information about many
species of ants and the results of some discoveries found by myrmecologist Walter Tschinkel of the University of Florida.
Information included the scientific name of the ant species, the geographic location, the depth of the nest (in feet), the number
of chambers in the nest, and the number of ants in the colony. The article documented how new ant colonies begin, the
ant-nest design, and how nests differ in shape, number, size of chambers, and how they are connected, depending on the
species. It reported that nest designs include vertical, horizontal, or inclined tunnels for movement and transport of food and
ants.
-Describe the W's, if the information is given:
• Who:
• What:
• When:
• Where:
• How:
• Why:
Free
(Essay)
4.7/5 (29)
Correct Answer:Verified
• Who: Colonies of ants. "Many species of ants," but no indication of exactly how
many.
• What: scientific name, geographic location, average nest depth, average number of
chambers,
average colony size, how new ant colonies begin, the ant-nest design, and how
nests differ
in architecture.
• When: November 2003
• Where: not specified
• How: The results of some discoveries found by myrmecologist Walter Tschinkel of
the University
of Florida
• Why: Information of interest to readers of the magazine
A research company frequently monitors trends in the use of social media by American Adults. The results of one survey of 1846 randomly selected adults looked at social media use versus age group. The table summarizes the survey results.  -Do you think social media use is independent of age? Give statistical evidence to support your conclusion.
(Essay)
5.0/5 (33)
The United States Census collects data on many variables about individuals and households.
Which variable is categorical?
(Multiple Choice)
4.8/5 (38)
The students in a biology class kept a record of the height (in centimeters) of plants for a
class experiment. 49 67 38 55 62 54 36 41 56 43 48 75 44 60 48 52 48 53 59 32
a. Sketch a histogram for these data.
b. Find the mean and standard deviation of the plant heights.
c. Is it appropriate to use the mean and standard deviation to summarize these data?
Explain.
d. Describe the association of plant heights.
(Essay)
4.8/5 (37)
Paying for purchases One day a store tracked the way shoppers paid for their purchases.
Their data are summarized in the table. 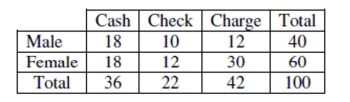 a. What percent of men paid cash?
b. What is the conditional relative frequency distribution of payment method for women?
c. If you wanted to show the association between gender and method of payment visually,
what kind of graph would you make? (Just name it.)
d. Is there evidence of an association between gender and method of payment? Explain
briefly.
a. What percent of men paid cash?
b. What is the conditional relative frequency distribution of payment method for women?
c. If you wanted to show the association between gender and method of payment visually,
what kind of graph would you make? (Just name it.)
d. Is there evidence of an association between gender and method of payment? Explain
briefly.
(Essay)
4.8/5 (31)
Which is true of the data shown in the histogram?  I. The distribution is approximately symmetric.
II) The mean and median are approximately equal.
III) The median and IQR summarize the data better than the mean and standard deviation.
I. The distribution is approximately symmetric.
II) The mean and median are approximately equal.
III) The median and IQR summarize the data better than the mean and standard deviation.
(Multiple Choice)
4.9/5 (43)
Health insurance The World Almanac and Book of Facts 2004 reported the percent of people not covered by health insurance in the 50 states and Washington, D.C., for the year 2002. Computer output gives these summaries for the percent of people not covered by health insurance: Min Q1 Median Q3 Max Mean SD 7.9 10.8 13.4 16.7 25.8 13.9 3.6
a. Were any of the states outliers? Explain how you made your decision.
b. A histogram of the data is as follows:
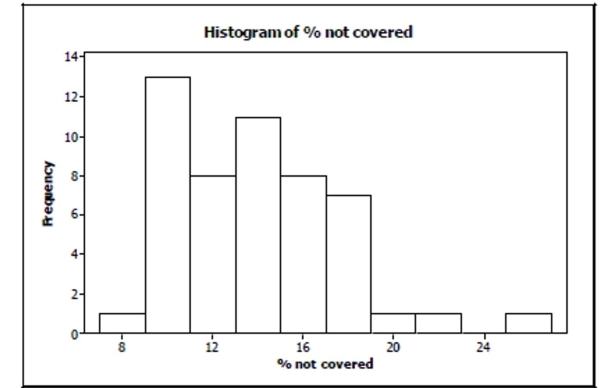 Is it more appropriate to use the mean and standard deviation or the median and IQR to
describe these data? Explain.
Is it more appropriate to use the mean and standard deviation or the median and IQR to
describe these data? Explain.
(Essay)
4.9/5 (43)
The mean number of hours worked for the 30 males was 6, and for the 20 females was 9. The
Overall mean number of hours worked …
(Multiple Choice)
4.8/5 (33)
Which of these variables about German Shepherds is most likely to be described by a Normal
Model?
(Multiple Choice)
4.8/5 (44)
A research company frequently monitors trends in the use of social media by American Adults. The results of one survey of 1846 randomly selected adults looked at social media use versus age group. The table summarizes the survey results.  -Find each percent.
a) What percent of adults surveyed are social media users aged 30-49?
b) What percent of the social media users are aged 30-49?
c) What percent of adults aged 30-49 are social media users?
-Find each percent.
a) What percent of adults surveyed are social media users aged 30-49?
b) What percent of the social media users are aged 30-49?
c) What percent of adults aged 30-49 are social media users?
(Essay)
4.8/5 (36)
The veterinary bills for the dogs are summarized in the ogive shown. Estimate the IQR of these
Expenses. 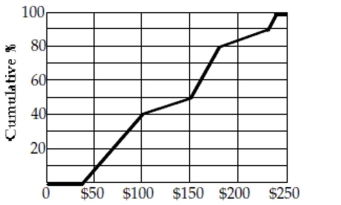
(Multiple Choice)
5.0/5 (39)
To determine if people's preference in dogs had changed in the recent years, organizers of a local dog show asked people who attended the show to indicate which breed was their favorite. This information was compiled by dog breed and gender of the people who responded. The table summarizes the responses.  -Do you think the breed selection is independent of gender? Give statistical evidence to support your conclusion.
(Essay)
4.8/5 (45)
The five-number summary for the fuel economy (in miles per gallon) of year 2011 midsize
cars is: Min Q1 Median Q3 Max 13 21 23 26 50
a. Would you expect the mean gas mileage of all midsize cars to be higher or lower than the median? Explain.
b. One model of Volkswagon gets 34 mpg, one model of Toyota gets 28 mpg, and one model of Bentley gets 13 mpg. Are any of these cars outliers (according to the original statistics above)? Explain.
(Essay)
4.9/5 (39)
To determine if people's preference in dogs had changed in the recent years, organizers of a local dog show asked people who attended the show to indicate which breed was their favorite. This information was compiled by dog breed and gender of the people who responded. The table summarizes the responses.  -Find each percent.
a. What percent of the responses were from males who favor Labradors?
b. What percent of the male responses favor Labradors?
c. What percent of the people who choose Labradors were males?
-Find each percent.
a. What percent of the responses were from males who favor Labradors?
b. What percent of the male responses favor Labradors?
c. What percent of the people who choose Labradors were males?
(Essay)
4.7/5 (30)
Last weekend police ticketed 18 men whose mean speed was 72 miles per hour, and 30 women
Going an average of 64 mph. Overall, what was the mean speed of all the people ticketed?
(Multiple Choice)
4.8/5 (40)
During a budget meeting, local school board members decided to review class size information to determine if budgets were correct. Summary statistics are shown in the
table. 33.39 students s 5.66 students min 17 Q1 29 median 33 Q3 40 max 40
a. Notice that the third quartile and maximum class sizes are the same. Explain how this can be.
b. The school district declares that classes with enrollments fewer than 20 students are "too
small". Would you consider a class of 20 students to be unusually small? Explain.
c. The school district sets the office supply budgets of their high schools on the enrollment
of students. The district budgets each class $12 plus $0.75 per student, so a class with one
student receives $12.75 and the classes with 40 students receive
What is the median class budget for office supplies? And the IQR?
d. What are the mean and standard deviation of the class office supply budgets?
(Essay)
4.9/5 (39)
School administrators collect data on students attending the school. Which of the following
Variables is quantitative?
(Multiple Choice)
4.8/5 (34)
A research company frequently monitors trends in the use of social media by American Adults. The results of one survey of 1846 randomly selected adults looked at social media use versus age group. The table summarizes the survey results.  -Identify the variables and tell whether each is categorical or quantitative.
(Essay)
4.9/5 (40)
Filters
- Essay(0)
- Multiple Choice(0)
- Short Answer(0)
- True False(0)
- Matching(0)