Exam 6: Accessing Associations Between Variables
Exam 1: Exploring and Understanding Data125 Questions
Exam 2: Exploring Relationships Between Variables165 Questions
Exam 3: Gathering Data111 Questions
Exam 4: Randomness and Probability148 Questions
Exam 5: From the Data at Hand to the World at Large128 Questions
Exam 6: Accessing Associations Between Variables93 Questions
Exam 7: Inference When Variables Are Related25 Questions
Exam 8: Regression, Associations, and Predictive Modeling792 Questions
Select questions type
An elementary school principal wants to know the mean number of children in families whose
Children attend this school. He checks all the families using the school's registration records, and we
Create a 95% confidence interval based on a t-distribution. This procedure was not appropriate.
Why?
(Multiple Choice)
4.8/5  (40)
(40)
A random sample of 120 classrooms at a large university found that 70% of them had been cleaned
Properly. What is the standard error of the sample proportion?
(Multiple Choice)
4.8/5 (35)
Which statement correctly compares t-distributions to the normal distribution?
I. t distributions are also mound shaped and symmetric.
II. t distributions have less spread than the normal distribution.
III. As degrees of freedom increase, the variance of t distributions becomes smaller.
(Multiple Choice)
4.9/5 (43)
Trainers need to estimate the level of fat in athletes to ensure good health. Initial tests were based
On a small sample but now the trainers double the sample size for a followup test. The main
Purpose of the larger sample is to…
(Multiple Choice)
4.8/5 (36)
Based on data from two very large independent samples, two students tested a hypothesis about
Equality of population means using
2) One student used a one-tail test and rejected the null
Hypothesis, but the other used a two-tail test and failed to reject the null. Which of these might
Have been their calculated value of t?
(Multiple Choice)
4.9/5 (49)
A soft drink company is conducting research to select a new design for the can. A random
sample of participants has been selected. Instead of a typical taste test with two different
sodas, they actually give each participant the same soda twice. One drink is served in a
predominantly red can, the other in a predominantly blue can. The order is chosen
randomly. Participants are asked to rate each drink on a scale of 1 to 10. Thus, the company
wishes to test if the color of the can influences the rating. The ratings were recorded for
each participant. The data are shown in the table below. Does this sample indicate that
there is a difference in the ratings? Test an appropriate hypothesis and state your
conclusion. Rater Red Blue 1 4 6 2 7 5 3 3 6 4 8 9 5 5 2 6 9 9 7 7 10 8 5 4 9 6 8 10 9 7 11 8 8 12 3 7 13 6 5 14 8 8 15 9 10 16 7 6
(Essay)
5.0/5 (32)
Gas mileage Hoping to improve the gas mileage of their cars, a car company has made an
adjustment in the manufacturing process. Random samples of automobiles coming off the
assembly line have been measured each week that the plant has been in operation. The
data from before and after the manufacturing adjustments were made are in the table. It is
believed that measurements of gas mileage are normally distributed. Write a complete
conclusion about the manufacturing adjustments based on the statistical software printout
shown below. 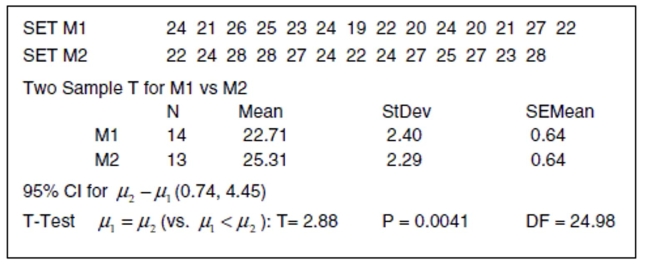
(Essay)
5.0/5 (33)
A professor was curious about her students' grade point averages (GPAs). She took a random
Sample of 15 students and found a mean GPA of 3.01 with a standard deviation of 0.534. Which of
The following formulas gives a 99% confidence interval for the mean GPA of the professor's
Students?
(Multiple Choice)
4.8/5 (33)
Scrubbers A factory recently installed new pollution control equipment ("scrubbers") on its
smokestacks in hopes of reducing air pollution levels at a nearby national park. Randomly
timed measurements of sulfate levels (in micrograms per cubic meter) were taken before
(Set C1) and after (Set C2) the installation. We believe that measurements of sulfate levels
are normally distributed. Write a complete conclusion about the effectiveness of these
scrubbers based on the statistical software printout shown. 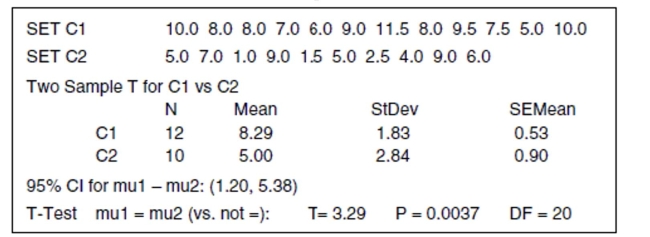
(Essay)
4.8/5 (39)
Based on data from two very large independent samples, two students tested a hypothesis about
Equality of population means using
2) One student used a one-tail test and rejected the null
Hypothesis, but the other used a two-tail test and failed to reject the null. Which of these might
Have been their calculated value of t?
(Multiple Choice)
4.8/5 (44)
A marketing company reviewing the length of television commercials monitored a random sample
Of commercials over several days. They found that a 95% confidence interval for the mean length
(in seconds) of commercials aired daily was (23, 27). Which is true?
(Multiple Choice)
5.0/5 (36)
The two samples whose statistics are given in the table thought to come from populations with
Equal variances. What is the pooled estimate of the population standard deviation? n Mean SD 50 22 3 55 25 4
(Multiple Choice)
4.9/5 (47)
A professor runs a regression to see how students' exam scores (Y) are related to their homework
Grades (X). The R2 of the regression is 21%. What does R2 tell us?
(Multiple Choice)
4.9/5 (38)
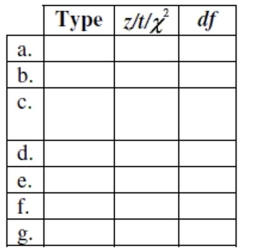
Test identification Suppose you were asked to analyze each of the situations described below.
(NOTE: Do not do these problems!) For each, indicate which procedure you would use (pick the appropriate number from the list), the test statistic ( , , or "chi-squared"), and, if or , the number of degrees of freedom. A choice may be used more than once.
 1. proportion - 1 sample
2. difference of proportions - 2 samples
3. mean - 1 sample
4. difference of means - independent samples
5. mean of differences - matched pairs
6. goodness of fit
7. homogeneity
8. independence
a. Which takes less time to travel to work-car or train? We select a random sample of 45
businessmen, observe them commuting using both methods, and compare their travel
times.
b. A college professor wonders if two versions (A and
B) of his exam are equally difficult.
He randomly mixes 20 Version A's and 20 Version B's together and passes them out to his
40 students. After grading the exams, he compares the scores for the two versions.
c. Forty people complaining of allergies take an antihistamine. They report that their
discomfort subsided in an average of 18 minutes; the standard deviation was 4 minutes.
The manufacturer wants a 95% confidence interval for the "relief time".
d. A health professional selected a random sample of 100 patients from each of four major
hospital emergency rooms to see if the major reasons for emergency room visits are similar
in all four major hospitals. The major reason categories are accident, illegal activity, illness,
or other.
e. A policeman believes that about 40% of older drivers speed on highways, but a
confidential survey found that 49 of 88 randomly selected older drivers admitted speeding
on highways at least once. Is this strong evidence that the policeman was wrong?
f. According to United Nations Population Division, the age distribution of the
Commonwealth of Australia is: 21% less than 15 years of age, 67% between 15 and 65 years
of age, and 12% are over 65 years old. A random sample of 210 residents of Canberra
revealed 40 were less than 15 years of age, 145 were between 15 and 65 years of age, and 25
were over 65 years old. Is Canberra unusual in any way?
g. Among a random sample of college-age students, 6% of the 473 men said they had been
adopted, compared to only 4% of the 552 women. Does this indicate a significant difference
between adoption rates of males and females in college-age students?
1. proportion - 1 sample
2. difference of proportions - 2 samples
3. mean - 1 sample
4. difference of means - independent samples
5. mean of differences - matched pairs
6. goodness of fit
7. homogeneity
8. independence
a. Which takes less time to travel to work-car or train? We select a random sample of 45
businessmen, observe them commuting using both methods, and compare their travel
times.
b. A college professor wonders if two versions (A and
B) of his exam are equally difficult.
He randomly mixes 20 Version A's and 20 Version B's together and passes them out to his
40 students. After grading the exams, he compares the scores for the two versions.
c. Forty people complaining of allergies take an antihistamine. They report that their
discomfort subsided in an average of 18 minutes; the standard deviation was 4 minutes.
The manufacturer wants a 95% confidence interval for the "relief time".
d. A health professional selected a random sample of 100 patients from each of four major
hospital emergency rooms to see if the major reasons for emergency room visits are similar
in all four major hospitals. The major reason categories are accident, illegal activity, illness,
or other.
e. A policeman believes that about 40% of older drivers speed on highways, but a
confidential survey found that 49 of 88 randomly selected older drivers admitted speeding
on highways at least once. Is this strong evidence that the policeman was wrong?
f. According to United Nations Population Division, the age distribution of the
Commonwealth of Australia is: 21% less than 15 years of age, 67% between 15 and 65 years
of age, and 12% are over 65 years old. A random sample of 210 residents of Canberra
revealed 40 were less than 15 years of age, 145 were between 15 and 65 years of age, and 25
were over 65 years old. Is Canberra unusual in any way?
g. Among a random sample of college-age students, 6% of the 473 men said they had been
adopted, compared to only 4% of the 552 women. Does this indicate a significant difference
between adoption rates of males and females in college-age students?
(Essay)
4.9/5 (40)
One common method of evaluating the performance of a mutual fund is to compare its returns to those of a recognized
benchmark such as an index of the returns on all securities of the type that the fund accumulates. The Janus Worldwide Fund
considers its benchmark to be the MSCI World IndexSM. The table below depicts the annual returns (percent) for a recent
ten-year period. Is this fund a good investment? That is, does this fund significantly outperform its benchmark? 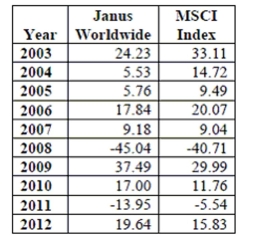 Source:
https://ww3.janus.com/advisor/Documents/Advisor%20Lit%20System/Fact%20Sheets/4Q12%20Fact%20Sheet%20(Janus%20Worldw
ide%20Fund-Class%20A)_exp%2004-15-13.pdf
-Carry out the appropriate test and state your conclusion in context.
Source:
https://ww3.janus.com/advisor/Documents/Advisor%20Lit%20System/Fact%20Sheets/4Q12%20Fact%20Sheet%20(Janus%20Worldw
ide%20Fund-Class%20A)_exp%2004-15-13.pdf
-Carry out the appropriate test and state your conclusion in context.
(Essay)
4.9/5 (37)
Blood pressure Researchers developing new drugs must be concerned about possible side
effects. They must check a new medication for arthritis to be sure that it does not cause an
unsafe increase in blood pressure. They measure the blood pressures of a group of 12
subjects, then administer the drug and recheck the blood pressures one hour later. The
drug will be approved for use unless there is evidence that blood pressure has increased an
average of more than 20 points. They will test a hypothesis using
a. Write appropriate hypotheses (in words and in symbols).
b. In this context, which do you consider to be more serious - a Type I or a Type II error?
Explain briefly.
c. After this experiment produced inconclusive results the researchers decided to test the
drug again another group of patients. Describe two changes they could make in their
experiment to increase the power of their test, and explain the disadvantages of each.
(Essay)
4.8/5 (42)
The vast majority of states and the District of Columbia have adopted the Common Core
State Standards (CCSS) for math and English language arts. Do teachers support the CCSS?
In March 2003, The American Federal of Teachers (AFT) asked AFT member teachers
"Based on what you know about the Common Core State Standards and the expectations
they set for children, do you approve or disapprove of your state's decision to adopt them?
" The following results were reported in American Educator (Volume 32, No. 2, Summer
2013, pg. 3): 27% Strongly Approve; 48% Somewhat Approve; 14% Somewhat Disapprove;
8% Strongly Approve; 3% Not Sure.
A district superintendent asked the same question to the teachers in her district to assess
the level of teacher support for the CCSS within the district. She obtained the following
results. Response Strongly Approve Somewhat Approve Somewhat Disapprove Strongly Disapprove Not Sure Frequency 55 106 28 32 9
a. Test an appropriate hypothesis to ascertain if the district CCSS approval distribution
matches the national AFT approval distribution.
b. Which response impacted your decision the most? Explain what this means in the
context of the problem.
(Essay)
4.9/5 (38)
A total of 23 Gossett High School students were admitted to State University. Of those
students, 7 were offered athletic scholarships. The school's guidance counselor looked at their
composite ACT scores (shown in the tabl, wondering if State U. might admit people with
lower scores if they also were athletes. Assuming that this group of students is representative
of students throughout the state, what do you think? 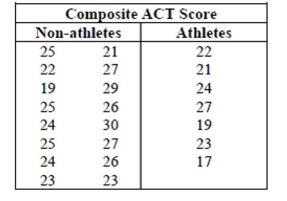 -Test an appropriate hypothesis and state your conclusion.
(Essay)
4.8/5 (39)
College admissions According to information from a college admissions office, 62% of the
students there attended public high schools, 26% attended private high schools, 2% were
home schooled, and the remaining students attended schools in other countries. Among
this college's Honors Graduates last year there were 47 who came from public schools, 29
from private schools, 4 who had been home schooled, and 4 students from abroad. Is there
any evidence that one type of high school might better equip students to attain high
academic honors at this college? Test an appropriate hypothesis and state your conclusion.
(Essay)
4.9/5 (36)
A random sample of 120 classrooms at a large university found that 70% of them had been cleaned
Properly. What is the standard error of the sample proportion?
(Multiple Choice)
4.8/5 (36)
Filters
- Essay(0)
- Multiple Choice(0)
- Short Answer(0)
- True False(0)
- Matching(0)