Exam 6: Accessing Associations Between Variables
Exam 1: Exploring and Understanding Data125 Questions
Exam 2: Exploring Relationships Between Variables165 Questions
Exam 3: Gathering Data111 Questions
Exam 4: Randomness and Probability148 Questions
Exam 5: From the Data at Hand to the World at Large128 Questions
Exam 6: Accessing Associations Between Variables93 Questions
Exam 7: Inference When Variables Are Related25 Questions
Exam 8: Regression, Associations, and Predictive Modeling792 Questions
Select questions type
We want to know the mean winning score at the US Open golf championship. An internet search
Gives us all the scores for the history of that tournament, and we create a 95% confidence interval
Based on a t-distribution. This procedure was not appropriate. Why?
(Multiple Choice)
4.8/5  (31)
(31)
Which statement correctly compares t-distributions to the Normal distribution?
I. t distributions are also mound shaped and symmetric.
II. t distributions are more spread out than the normal distribution.
III. As degrees of freedom increase, the variance of t distributions becomes larger.
(Multiple Choice)
4.7/5 (32)
One common method of evaluating the performance of a mutual fund is to compare its returns to those of a recognized
benchmark such as an index of the returns on all securities of the type that the fund accumulates. The Janus Worldwide Fund
considers its benchmark to be the MSCI World IndexSM. The table below depicts the annual returns (percent) for a recent
ten-year period. Is this fund a good investment? That is, does this fund significantly outperform its benchmark? 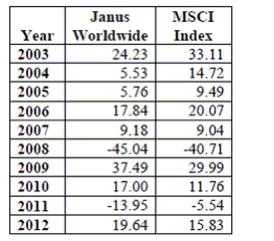 Source:
https://ww3.janus.com/advisor/Documents/Advisor%20Lit%20System/Fact%20Sheets/4Q12%20Fact%20Sheet%20(Janus%20Worldw
ide%20Fund-Class%20A)_exp%2004-15-13.pdf
-Explain clearly whether this data should be analyzed using a 2-sample t test approach or a
match pairs t-test method.
Source:
https://ww3.janus.com/advisor/Documents/Advisor%20Lit%20System/Fact%20Sheets/4Q12%20Fact%20Sheet%20(Janus%20Worldw
ide%20Fund-Class%20A)_exp%2004-15-13.pdf
-Explain clearly whether this data should be analyzed using a 2-sample t test approach or a
match pairs t-test method.
(Essay)
4.9/5 (34)
Which statement correctly compares t-distributions to the normal distribution?
I. t distributions are also mound shaped and symmetric.
II. t distributions have less spread than the normal distribution.
III. As degrees of freedom increase, the variance of t distributions becomes smaller.
(Multiple Choice)
4.8/5 (35)
Before you took this course, you probably heard many stories about Statistics courses. Oftentimes parents of students have
had bad experiences with Statistics courses and pass on their anxieties to their children. To test whether actually taking
Statistics decreases students' anxieties about Statistics, a Statistics instructor gave a test to rate student anxiety at the
beginning and end of his course. Anxiety levels were measured on a scale of 0-10. Here are the data for 16 randomly chosen
students from a class of 180 students: Pre-course anxiety level 7 6 9 5 6 7 5 7 6 4 3 2 1 3 4 2 Post-course anxiety level 4 3 7 3 4 5 4 6 5 3 2 2 1 3 4 3 Difference (Post - Pre) -3 -3 -2 -2 -2 -2 -1 -1 -1 -1 -1 0 0 0 0 1
-Do the data indicate that anxiety levels about Statistics decreases after students take
Statistics? Test an appropriate hypothesis and state your conclusion.
(Essay)
4.9/5 (41)
A wildlife biologist wants to determine the mean weight of adult red squirrels. She captures 10
Squirrels she believes to be representative of the species and weighs them, finding a mean of 12.32
Grams and standard deviation of 1.88 gm. Assuming these squirrels can be considered a random
Sample of all red squirrels which of the following formulas gives a 95% confidence interval for the
Mean weight of all squirrels?
(Multiple Choice)
4.7/5 (41)
Autos Hoping to improve the gas mileage of their cars, a car company has made an
adjustment in the manufacturing process. Random samples of automobiles coming off the
assembly line have been measured each week that the plant has been in operation. The
data from before and after the manufacturing adjustments were made are in the table. It is
believed that measurements of gas mileage are normally distributed. Write a complete
conclusion about the manufacturing adjustments based on the statistical software printout
shown below. 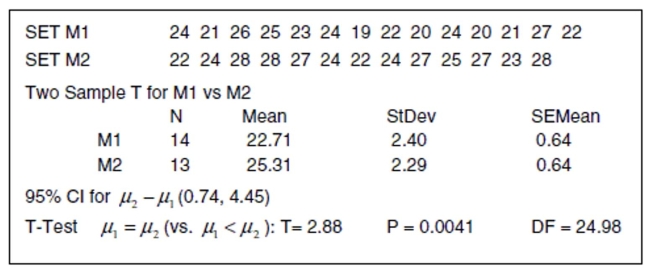
(Essay)
4.7/5 (38)
Cloning A random sample of 800 adults was asked the following question: "Do you think
current laws concerning the use of cloning for medical research are too strict, too lenient, or about
right?" The pollsters also classified the respondents with respect to highest education level
attained: high school, 2- year college degree, 4-year degree, or advanced degree. We wish
to know if attitudes on cloning are related to education level. (All the conditions are
satisfied - don't worry about checking them.) 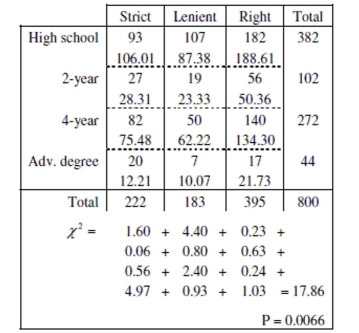 a. Write appropriate hypotheses.
b. Suppose the expected counts had not been given. Show how to calculate the expected
count in the first cell (106.01).
c. How many degrees of freedom? Explain.
d. State your complete conclusion in context.
a. Write appropriate hypotheses.
b. Suppose the expected counts had not been given. Show how to calculate the expected
count in the first cell (106.01).
c. How many degrees of freedom? Explain.
d. State your complete conclusion in context.
(Essay)
4.9/5 (35)
A random sample of 120 college seniors found that 30% of them had been offered jobs. What is the
Standard error of the sample proportion?
(Multiple Choice)
4.9/5 (33)
Poverty In a study of how the burden of poverty varies among U. S. regions, a random
sample of 1000 individuals from each region of the United States recently yielded the
information on poverty (based on defining the poverty level as an income below $10,400
for a family of 4 people). The data and calculation of the test statistic is shown in the table
below. (All the conditions are satisfied - don'ft worry about checking them.) 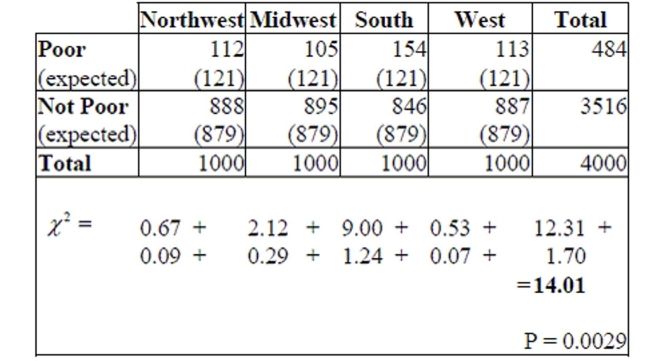 a. Write appropriate hypotheses.
b. Suppose the expected values had not been given. Show exactly how to calculate the
expected count in the first cell.
c. How many degrees of freedom are there?
d. State your complete conclusion in context.
a. Write appropriate hypotheses.
b. Suppose the expected values had not been given. Show exactly how to calculate the
expected count in the first cell.
c. How many degrees of freedom are there?
d. State your complete conclusion in context.
(Essay)
5.0/5 (37)
Could eye color be a warning signal for hearing loss in patients suffering from meningitis?
British researcher Helen Cullington recorded the eye color of 130 deaf patients, and noted
whether the patient's deafness had developed following treatment for meningitis. Her data
are summarized in the table below. Test an appropriate hypothesis and state your
conclusion. 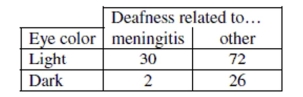
(Essay)
4.9/5 (40)
An elementary school principal wants to know the mean number of children in families whose
Children attend this school. He checks all the families using the school's registration records, and we
Create a 95% confidence interval based on a t-distribution. This procedure was not appropriate.
Why?
(Multiple Choice)
4.9/5 (39)
Most people are definitely dominant on one side of their body - either right or left. For some sports being able to use both
sides is an advantage, such as batting in baseball or softball. In order to determine if there is a difference in strength between
the dominant and nondominant sides, a few switch-hitting members of some school baseball and softball teams were asked
to hit from both sides of the plate during batting practice. The longest hit (in feet) from each side was recorded for each
player. The data are shown in the table below. Batter Dominant Side Non-dominant Side 1 142 119 2 144 118 3 153 126 4 148 119 5 146 121 6 149 125 7 138 116 8 145 120 9 153 124 10 160 138 11 163 135 12 170 144 13 169 142 14 151 128 15 152 131 16 167 141 17 164 140 18 165 140 19 163 138
-Create and interpret a 95% confidence interval.
(Essay)
4.9/5 (35)
Filters
- Essay(0)
- Multiple Choice(0)
- Short Answer(0)
- True False(0)
- Matching(0)