Exam 6: Accessing Associations Between Variables
Exam 1: Exploring and Understanding Data125 Questions
Exam 2: Exploring Relationships Between Variables165 Questions
Exam 3: Gathering Data111 Questions
Exam 4: Randomness and Probability148 Questions
Exam 5: From the Data at Hand to the World at Large128 Questions
Exam 6: Accessing Associations Between Variables93 Questions
Exam 7: Inference When Variables Are Related25 Questions
Exam 8: Regression, Associations, and Predictive Modeling792 Questions
Select questions type
Housing costs A government report on housing costs says that single-family home prices
nationwide are skewed to the right, with a mean of $235,700. We want to see how home
prices in Orange County, California compare with those nationwide.
a. We collect price data from a random sample of 50 homes in Orange County, California.
Why is it okay to use these data for inference even though the population is skewed?
b. The standard deviation of the 50 homes in our sample was $25,500. Specify the sampling
model for the mean price of such samples.
c. This sample of randomly chosen homes produced a 90% confidence interval for the
mean price in Orange County of ($233954, $246046). Does this interval provide evidence
that single-family home prices are unusually high in this county? Explain briefly.
d. Suppose we want to collect a new sample. How many homes must we survey to have
90% confidence of estimating the mean local price to within $2000?
(Essay)
4.9/5  (34)
(34)
The two samples whose statistics are given in the table are thought to come from populations with
Equal variances. What is the pooled estimate of the population standard deviation? n Mean SD 12 45 6 16 41 8
(Multiple Choice)
4.9/5 (38)
Food inspectors need to estimate the level of contaminants in food products packaged at a certain
Factory. Initial tests were based on a small sample but now the inspectors double the sample size for
A follow-up test. The main purpose of the larger sample is to…
(Multiple Choice)
4.8/5 (41)
A manufacturing plant for recreational vehicles receives shipments from three different
parts vendors. There has been a defect issue with some of the electrical wiring in the
recreational vehicles manufactured at the plant. The plant manager wonders if all of the
vendors might be contributing equally to the defect issue. The plant manager reviews three
samples of quality assurance inspections from the last six months, one from each of the
vendors. The data are shown in the table below. 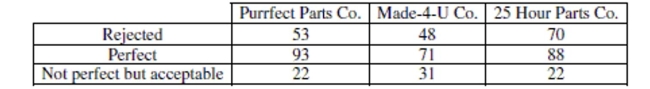 Test an appropriate hypothesis to decide if the plant manager is correct. Give statistical
evidence to support your conclusion.
Test an appropriate hypothesis to decide if the plant manager is correct. Give statistical
evidence to support your conclusion.
(Essay)
4.8/5 (41)
A researcher found that a 98% confidence interval for the mean hours per week spent studying by
College students was (13, 17). Which is true?
I. There is a 98% chance that the mean hours per week spent studying by college students is
Between 13 and 17 hours.
II. 98% of college students study between 13 and 17 hours a week.
III. Students average between 13 and 17 hours per week studying on 98% of the weeks.
(Multiple Choice)
4.9/5 (36)
A survey asked people "On what percent of days do you get more than 30 minutes of vigorous
Exercise?" Using their responses we want to estimate the difference in exercise frequency between
Men and women. We should use a
(Multiple Choice)
4.8/5 (44)
At one SAT test site students taking the test for a second time volunteered to inhale supplemental
Oxygen for 10 minutes before the test. In fact, some received oxygen, but others (randomly
Assigned) were given just normal air. Test results showed that 42 of 66 students who breathed
Oxygen improved their SAT scores, compared to only 35 of 63 students who did not get the oxygen.
Which procedure should we use to see if there is evidence that breathing extra oxygen can help
Test-takers think more clearly?
(Multiple Choice)
4.9/5 (34)
In 2010, the United Nations claimed that there was a higher rate of illiteracy in men than in women from the country of
Qatar. A humanitarian organization went to Qatar to conduct a random sample. The results revealed that 45 out of 234 men
and 42 out of 251 women were classified as illiterate on the same measurement test. Do these results indicate that the United
Nations findings were correct?
-Find a 95% confidence level for the difference in the proportions of illiteracy in men and
women from Qatar. Interpret your interval.
(Essay)
4.7/5 (36)
Graduation tests Many states mandate tests that have to be passed in order for students to
graduate with a high school diploma. A local school superintendent believes that
after-school tutoring will improve the scores of students in his district on the state's
graduation test. A tutor agrees to work with 15 students for a month before the
superintendent will approach the school board about implementing an after-school
tutoring program. The after-school tutoring program will be implemented if student
scores increase by more than 20 points. The superintendent will test a hypothesis using α
0.02 .
a. Write appropriate hypotheses (in words and in symbols).
b. In this context, which do you consider to be more serious - a Type I or a Type II error?
Explain.
c. After this trial produced inconclusive results, the superintendent decided to test the
after-school tutoring program again with another group of students. Describe two changes
he could make in the trial to increase the power of the test, and explain the disadvantages
of each.
(Essay)
4.7/5 (38)
Absorption rates into the body are important considerations when manufacturing a generic version
Of a brand-name drug. A pharmacist read that the absorption rate into the body of a new generic
Drug (G) is the same as its brand-name counterpart (B). She has a researcher friend of hers run a
Small experiment to test
0) Which of the
Following would be a Type I error?
(Multiple Choice)
4.8/5 (34)
Too much TV? A father is concerned that his teenage son is watching too much television
each day, since his son watches an average of 2 hours per day. His son says that his TV
habits are no different than those of his friends. Since this father has taken a stats class, he
knows that he can actually test to see whether or not his son is watching more TV than his
peers. The father collects a random sample of television watching times from boys at his
son's high school and gets the following data:
1.9 2.3 2.2 1.9 1.6 2.6 1.4 2.0 2.0 2.2
Is the father right? That is, is there evidence that other boys average less than 2 hours of
television per day? Conduct a hypothesis test, making sure to state your conclusions in the
context of the problem.
(Essay)
4.8/5 (24)
Every year favorite songs compete to be on a Top 200 list based upon sales and rankings by the experts in the music industry.
These songs have many characteristics, such as song length and beats per minute, which vary from category to category in
the music industry. A disc jockey wondered if the number of beats per minute in songs classified as dance music were lower
than the beats per minute in the songs that are ranked on a Top 200 list from 2001. A random sample of songs from each
group was selected and the beats per minute are listed in the chart at the right. Does this sample indicate that songs classified
as dance music have lower beats per minute than the songs ranked on a Top 200 list? 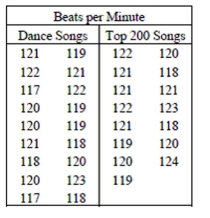 -Test an appropriate hypothesis and state your conclusion.
(Essay)
4.8/5 (45)
A contact lens wearer read that the producer of a new contact lens boasts that their lenses are
Cheaper than contact lenses from another popular company. She collected some data, then tested
The null hypothesis
0) Which of the
Following would be a Type II error?
(Multiple Choice)
4.9/5 (50)
When two competing teams are equally matched, the probability that each team wins any
game is 0.5. The NBA championship goes to the team that wins four games in a best-of
seven series. If the teams were equally matched, the probability that the final series ends
with one of the teams sweeping four straight games would be 2(0.5)4 = 0.125. Further
probability calculations indicate that 25% of these series should last five games, 31.25%
should last six games, and the other 31.25% should last the full seven games. The table
shows the number of games it took to decide each of the last 57 NBA champs. Do you think
the teams are usually equally matched? Give statistical evidence to support your
conclusion. Length of series 4 games 5 games 6 games 7 games NBA finals 7 13 22 15
(Essay)
4.8/5 (40)
A coffee house owner knows that customers pour different amounts of coffee into their cups. She
Samples cups from 10 costumers she believes to be representative of the customers and weighs the
Cups, finding a mean of 12.5 ounces and standard deviation of 0.5 ounces. Assuming these cups of
Coffee can be considered a random sample of all cups of coffee which of the following formulas
Gives a 95% confidence interval for the mean weight of all cups of coffee?
(Multiple Choice)
4.7/5 (32)
Most people are definitely dominant on one side of their body - either right or left. For some sports being able to use both
sides is an advantage, such as batting in baseball or softball. In order to determine if there is a difference in strength between
the dominant and nondominant sides, a few switch-hitting members of some school baseball and softball teams were asked
to hit from both sides of the plate during batting practice. The longest hit (in feet) from each side was recorded for each
player. The data are shown in the table below. Batter Dominant Side Non-dominant Side 1 142 119 2 144 118 3 153 126 4 148 119 5 146 121 6 149 125 7 138 116 8 145 120 9 153 124 10 160 138 11 163 135 12 170 144 13 169 142 14 151 128 15 152 131 16 167 141 17 164 140 18 165 140 19 163 138
-Does this sample indicate that there is a difference in the distance a ball is hit by batters
who are switch-hitters? Test an appropriate hypothesis and state your conclusion.
(Essay)
5.0/5 (35)
Great Britain has a great literary tradition that spans centuries. One might assume, then, that Britons read more than citizens
of other countries. Some Canadians, however, feel that a higher percentage of Canadians than Britons read. A recent Gallup
Poll reported that 86% of 1004 randomly sampled Canadians read at least one book in the past year, compared to 81% of 1009
randomly sampled Britons. Do these results confirm a higher reading rate in Canada?
-Test an appropriate hypothesis and state your conclusions.
(Essay)
4.9/5 (38)
Great Britain has a great literary tradition that spans centuries. One might assume, then, that Britons read more than citizens
of other countries. Some Canadians, however, feel that a higher percentage of Canadians than Britons read. A recent Gallup
Poll reported that 86% of 1004 randomly sampled Canadians read at least one book in the past year, compared to 81% of 1009
randomly sampled Britons. Do these results confirm a higher reading rate in Canada?
-Find a 99% confidence interval for the difference in the proportion of Britons and
Canadians who read at least one book in the last year. Interpret your interval.
(Essay)
4.9/5 (31)
At one vehicle inspection station, 13 of 52 trucks and 11 of 88 cars failed the emissions test.
Assuming these vehicles were representative of the cars and trucks in that area, what is the
Standard error of the difference in the percentages of all cars and trucks that are not in compliance
With air quality regulations?
(Multiple Choice)
4.7/5 (33)
A high school counselor was interested in finding out how well student grade point averages (GPA) predict ACT scores. A
sample of the senior class data was reviewed to obtain GPA and ACT scores. The data are shown in the table to the right. 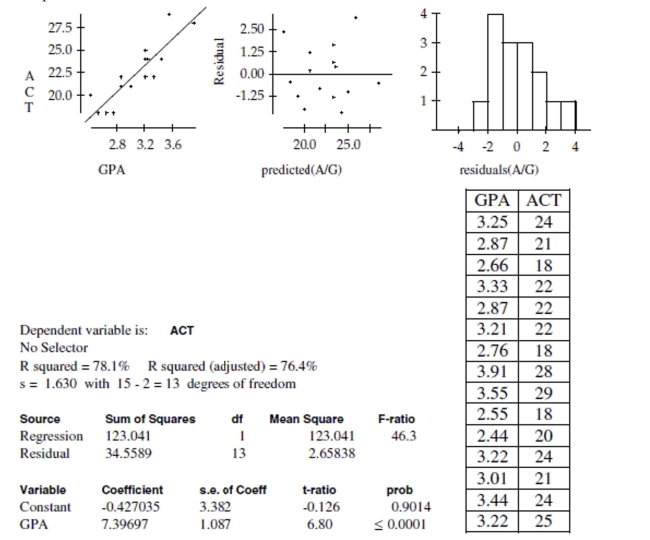 -Create and interpret a 95% confidence interval for the slope of the regression line.
(Essay)
4.8/5 (44)
Filters
- Essay(0)
- Multiple Choice(0)
- Short Answer(0)
- True False(0)
- Matching(0)