Exam 6: Accessing Associations Between Variables
Exam 1: Exploring and Understanding Data125 Questions
Exam 2: Exploring Relationships Between Variables165 Questions
Exam 3: Gathering Data111 Questions
Exam 4: Randomness and Probability148 Questions
Exam 5: From the Data at Hand to the World at Large128 Questions
Exam 6: Accessing Associations Between Variables93 Questions
Exam 7: Inference When Variables Are Related25 Questions
Exam 8: Regression, Associations, and Predictive Modeling792 Questions
Select questions type
The two samples whose statistics are given in the table are thought to come from populations with
Equal variances. What is the pooled estimate of the population standard deviation? n Mean SD 25 32 5 20 30 6
(Multiple Choice)
4.7/5  (37)
(37)
The Y-variable in a regression analysis is also known as the...
(Multiple Choice)
4.8/5 (34)
Investigators at an agricultural research facility randomly assigned equal numbers of chickens to be housed in two rooms. In one room, the chickens experienced normal day/night cycles, while in the other room lights were left on 24 hours a day to see if those chickens would lay more eggs. After collecting data for several days the researchers tested the hypothesis against the one-tail alternative and found . Which is true?
(Multiple Choice)
4.8/5 (41)
A high school counselor was interested in finding out how well student grade point averages (GPA) predict ACT scores. A
sample of the senior class data was reviewed to obtain GPA and ACT scores. The data are shown in the table to the right. 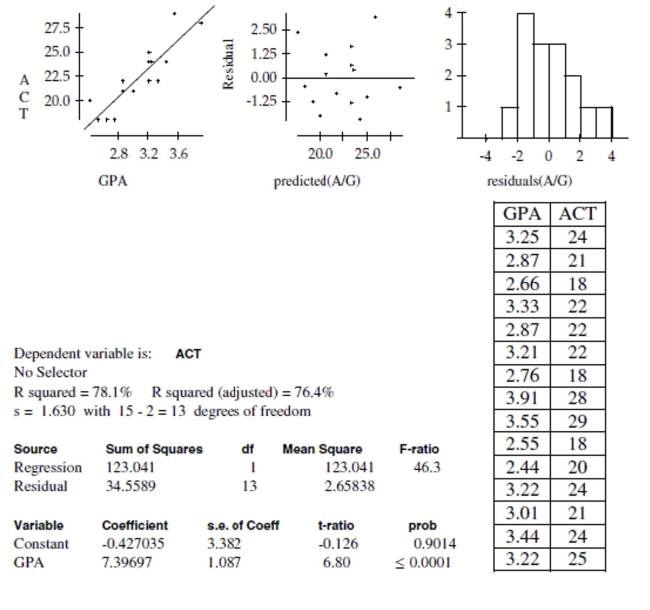 -Is there evidence of an association between GPA and ACT score? Test an appropriate
hypothesis and state your conclusion in the proper context.
-Is there evidence of an association between GPA and ACT score? Test an appropriate
hypothesis and state your conclusion in the proper context.
(Essay)
4.9/5 (36)
In 2010, the United Nations claimed that there was a higher rate of illiteracy in men than in women from the country of
Qatar. A humanitarian organization went to Qatar to conduct a random sample. The results revealed that 45 out of 234 men
and 42 out of 251 women were classified as illiterate on the same measurement test. Do these results indicate that the United
Nations findings were correct?
-Test an appropriate hypothesis and state your conclusion.
(Essay)
4.7/5 (36)
A marketing company reviewing the length of television commercials monitored a random sample
Of commercials over several days. They found that a 95% confidence interval for the mean length
(in seconds) of commercials aired daily was (23, 27). Which is true?
(Multiple Choice)
4.9/5 (30)
A biology professor reports that historically grades in her introductory biology course have
been distributed as follows: 15% A's, 30% B's, 40% C's, 10% D's, and 5% F's. Grades in her
most recent course were distributed as follows: Grade A B C D F Frequency 89 121 78 25 12
a. Test an appropriate hypothesis to decide if the professor's most recent grade distribution
matches the historical distribution. Give statistical evidence to support your conclusion.
b. Which grade impacted your decision the most? Explain what this means in the context of
the problem.
(Essay)
4.8/5 (31)
You could win a $1000 prize by tossing a coin in one of two games. To win Game A, you must get
Exactly 50% heads. To win Game B, you must get between 45% and 55% heads. Although which
Game you must play will be chosen randomly, then you may decide whether to toss the coin 20
Times or 50 times. How many tosses would you choose to make?
(Multiple Choice)
4.8/5 (31)
In a local school, vending machines offer a range of drinks from juices to sports drinks. The
purchasing agent thinks each type of drink is equally favored among the students buying
drinks from the machines. The recent purchasing choices from the vending machines are
shown in the table. Drink Type/Flavor Lemon Lime Sports Drink Kiwi Strawberry Tropical Punch Grape Sports Drink Frequency 159 198 174 149
a. Test an appropriate hypothesis to decide if the purchasing agent is correct. Give
statistical evidence to support your conclusion.
b. Which type of drink impacted your decision the most? Explain what this means in the
context of the problem.
(Essay)
4.8/5 (27)
Test identification Suppose you were asked to analyze each of the situations described below. (NOTE: Do not do these problems!) For each, indicate which procedure you would use (pick the appropriate number from the list), the test statistic ( , or "chi-squared"), and, if or , the number of degrees of freedom. A procedure may be used more than once.
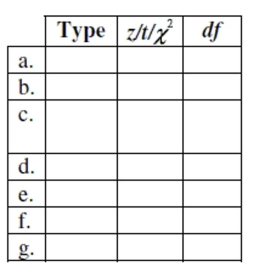 1. proportion - 1 sample
2. difference of proportions - 2 samples
3. mean - 1 sample
4. difference of means - independent samples
5. mean of differences - matched pairs
6. goodness of fit
7. homogeneity
8. independence
a. Among randomly selected pets, 27% of the 188 dogs and 18% of the 167 cats had fleas.
Does this indicate a significant difference in rates of flea problems for these two pets?
b. Are there more broken bones in summer or winter? We get records about the number of
fractures treated in January and July at a random sample of 25 emergency rooms.
c. A random sample of 600 high school seniors reported their grade point averages and the
amount of financial aid offered them by colleges. We wonder if there is an association
between academic success and college aid.
d. For a random sample of 200 drivers at a gas station, we record the driver's gender (male
or female) and the type of gasoline purchased (regular, plus, or premium). We wonder if
there is an association between a driver's gender and the type of gasoline they buy.
e. The school newspaper wants a 95% confidence interval for the road test failure rate. In a
random sample of 65 student drivers, 37 said they failed their driver's test at least once.
f. A supermarket chain wants to know which of two merchandise display methods is more
effective. They randomly assign 15 stores to use display type A and 15 others to use display
type B, then collect data about the number of items sold at each store.
g. Tags placed on garbage cans allow the disposal of up to 30 pounds of garbage. A
random sample of 22 cans averaged 33.2 pounds with a standard deviation of 3.2 pounds.
Is this strong evidence that residents overload their garbage cans?
1. proportion - 1 sample
2. difference of proportions - 2 samples
3. mean - 1 sample
4. difference of means - independent samples
5. mean of differences - matched pairs
6. goodness of fit
7. homogeneity
8. independence
a. Among randomly selected pets, 27% of the 188 dogs and 18% of the 167 cats had fleas.
Does this indicate a significant difference in rates of flea problems for these two pets?
b. Are there more broken bones in summer or winter? We get records about the number of
fractures treated in January and July at a random sample of 25 emergency rooms.
c. A random sample of 600 high school seniors reported their grade point averages and the
amount of financial aid offered them by colleges. We wonder if there is an association
between academic success and college aid.
d. For a random sample of 200 drivers at a gas station, we record the driver's gender (male
or female) and the type of gasoline purchased (regular, plus, or premium). We wonder if
there is an association between a driver's gender and the type of gasoline they buy.
e. The school newspaper wants a 95% confidence interval for the road test failure rate. In a
random sample of 65 student drivers, 37 said they failed their driver's test at least once.
f. A supermarket chain wants to know which of two merchandise display methods is more
effective. They randomly assign 15 stores to use display type A and 15 others to use display
type B, then collect data about the number of items sold at each store.
g. Tags placed on garbage cans allow the disposal of up to 30 pounds of garbage. A
random sample of 22 cans averaged 33.2 pounds with a standard deviation of 3.2 pounds.
Is this strong evidence that residents overload their garbage cans?
(Essay)
4.9/5 (37)
Flight costs Every year Educational Services (ETS) selects readers for the Advanced
Placement Exams. Recently the AP Statistics exam has been graded in Lincoln, Nebraska.
One objective of ETS is to achieve equity in grading by inviting teachers to be readers from
all parts of the nation. However budgets are a consideration also. The accountants at ETS
wonder if the flights from cities west of Lincoln are the same as flight costs from cities east
of Lincoln. A random sample of the expense vouchers from last year was reviewed for the
cost of airline tickets. Costs (in dollars) are shown in the table. East West 265 257 298 320 340 295 219 288 199 366 398 275 359 430 309 397 105 253 253 366
Indicate what inference procedure you would use to see if there is a significant difference
in the costs of airline flights between the west and east coasts to Lincoln, Nebraska, then
decide if it is okay to actually perform that inference procedure. (Check the appropriate
assumptions and conditions and indicate whether you could or could not proceed. You do
not have to do the actual test.)
(Essay)
4.8/5 (29)
Every year favorite songs compete to be on a Top 200 list based upon sales and rankings by the experts in the music industry.
These songs have many characteristics, such as song length and beats per minute, which vary from category to category in
the music industry. A disc jockey wondered if the number of beats per minute in songs classified as dance music were lower
than the beats per minute in the songs that are ranked on a Top 200 list from 2001. A random sample of songs from each
group was selected and the beats per minute are listed in the chart at the right. Does this sample indicate that songs classified
as dance music have lower beats per minute than the songs ranked on a Top 200 list? 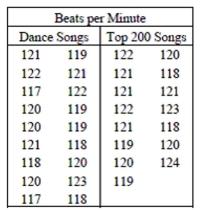 -Create and interpret a 90% confidence interval.
(Essay)
4.9/5 (37)
A San Jose State student collects data from 20 students. He compares the number of classes a student is enrolled in to their
GPA. Here are the results of the regression analysis. The conditions for inference are satisfied. 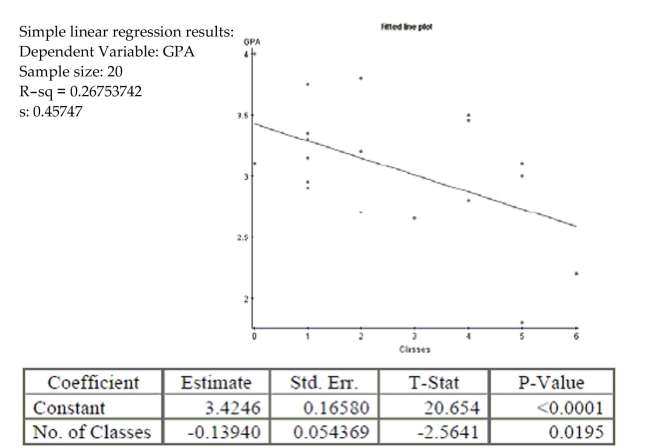 -Find and interpret a 95% confidence interval for the slope of the regression equation.
(Essay)
4.8/5 (42)
A total of 23 Gossett High School students were admitted to State University. Of those
students, 7 were offered athletic scholarships. The school's guidance counselor looked at their
composite ACT scores (shown in the tabl, wondering if State U. might admit people with
lower scores if they also were athletes. Assuming that this group of students is representative
of students throughout the state, what do you think? 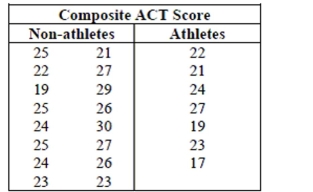 -Create and interpret a 90% confidence interval.
(Essay)
4.8/5 (43)
Packing Line A packing company investigates hiring a national training consultant to
improve productivity on their packing line. The consultant is very expensive, so they will
only hire him if they are very sure that productivity will rise. The company hires the
consultant for a one-week trial to work with 18 employees before making a final decision
about the training program. The training program will be implemented if the average units
packed per employee increases by more than 10 cases per day. The company manager will
test a hypothesis using
a. Write appropriate hypotheses (in words and in symbols).
b. In this context, which do you consider to be more serious - a Type I or a Type II error?
Explain briefly.
c. After this trial produced inconclusive results the manager decided to test the training
program again with another group of employees. Describe two changes he could make in
the trial to increase the power of the test, and explain the disadvantages of each.
(Essay)
4.8/5 (29)
A sports analyst was interested in finding out how well a football team's winning
percentage (stated as a proportion) can be predicted based upon points scored and points
allowed. She selects a random sample of 15 football teams. Each team played 10 games.
She decided to use the point differential, points scored minus points allowed as the
predictor variable. The data are shown in the table and regression output given below. 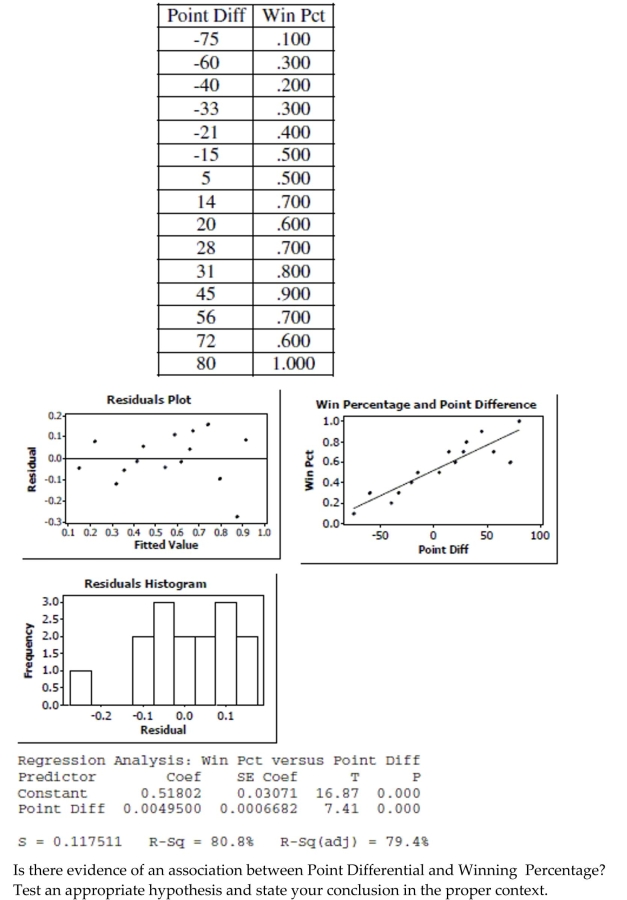
(Essay)
4.8/5 (41)
The two samples whose statistics are given in the table thought to come from populations with
Equal variances. What is the pooled estimate of the population standard deviation? n Mean SD 50 22 3 55 25 4
(Multiple Choice)
4.9/5 (38)
Doctors at a technology research facility randomly assigned equal numbers of people to use computer keyboards in two rooms. In one room a group of people typed a manuscript using standard keyboards, while in the other room people typed the same manuscript using ergonomic keyboards to see if those people could type more words per minute. After collecting data for several days the researchers tested the hypothesis against the one-tail alternative and found . Which is true?
(Multiple Choice)
4.7/5 (30)
Which of the following is true about Student's t-models?
I. They are unimodal, symmetric, and bell-shaped.
II. They have fatter tails than the Normal model.
III. As the degrees of freedom increase, the t-models look more and more like the Normal.
(Multiple Choice)
4.9/5 (38)
Auto repairs An insurance company hopes to save money on repairs to autos involved in
accidents. Two body shops in town seem to do most of the repairs, and the company
wonders whether one of them is generally cheaper than the other. From their files of
payments made during the past year they select a random sample of ten bills they paid at
each repair shop. The data are shown in the table. Bodies by Bock Velleman's Automagic 2130 2570 980 1120 3400 2950 2190 1880 1100 1660 1450 1700 4590 4030 3090 3970 1050 1130 2530 3660
Indicate what inference procedure you would use to see if there is a significant difference in the costs of repairs done at these two body shops, then decide if it is okay to actually perform that inference procedure. (Check the appropriate assumptions and conditions and indicate whether you could or could not proceed. You do not have to do the actual test.)
(Essay)
4.8/5 (28)
Filters
- Essay(0)
- Multiple Choice(0)
- Short Answer(0)
- True False(0)
- Matching(0)