Exam 1: Exploring and Understanding Data
Exam 1: Exploring and Understanding Data125 Questions
Exam 2: Exploring Relationships Between Variables165 Questions
Exam 3: Gathering Data111 Questions
Exam 4: Randomness and Probability148 Questions
Exam 5: From the Data at Hand to the World at Large128 Questions
Exam 6: Accessing Associations Between Variables93 Questions
Exam 7: Inference When Variables Are Related25 Questions
Exam 8: Regression, Associations, and Predictive Modeling792 Questions
Select questions type
In July 2013, the Federal Drug Administration approved a new version of a drug used to treat opium dependence. The old
version of the drug had received complaints about a bitter taste, an aftertaste, and that it took a long time to dissolve. The
goal of the new version was to get more patients to take the drug as prescribed by addressing these issues. In addition to
these improvements, experimenters monitored the existence and types of side effects of the drug.
-Describe the W's, if the information is given:
• Who:
• What:
• When:
• Where:
• How:
• Why:
(Essay)
4.9/5  (42)
(42)
The body temperature of students is taken each time a student goes to the nurse's office.
The five-number summary for the temperatures (in degrees Fahrenheit) of students on a particular day is: Min Q1 Median Q3 Max 96. 97.8 98.2 98. 101.
a. Would you expect the mean temperature of all students who visited the nurse's office to be higher or lower than the median? Explain.
b. After the data were picked up in the afternoon, three more students visited the nurse's
office with temperatures of 96.7°, 98.4°, and 99.2°. Were any of these students outliers
(according to the original statistics above)? Explain.
(Essay)
4.8/5 (28)
A brake and muffler shop reported the repair bills, in dollars, for their customers yesterday. 88 283 312 290 172 154 400 381 346 181 203 118 143 252 227 56 192 292 213 422
a. Sketch a histogram for these data.
b. Find the mean and standard deviation of the repair costs.
c. Is it appropriate to use the mean and standard deviation to summarize these data? Explain.
d. Describe the association of repair costs.
(Essay)
4.8/5 (39)
In order to plan transportation and parking needs at a private high school, administrators asked students how they get to
school. Some rode a school bus, some rode in with parents or friends, and others used "personal" transportation
skateboards, or just walked. The table summarizes the responses from boys and girls. 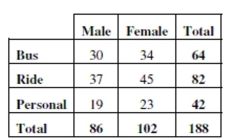 -What is the marginal distribution of gender?
(Short Answer)
4.8/5 (31)
In June 2003 Consumer Reports published an article on some sport-utility vehicles they had tested recently. They reported
some basic information about each of the vehicles and the results of some tests conducted by their staff. Among other things,
the article told the brand of each vehicle, its price, and whether it had a standard or automatic transmission. They reported
the vehicle's fuel economy, its acceleration (number of seconds to go from zero to 60 mph), and its braking distance to stop
from 60 mph. The article also rated each vehicle's reliability as much better than average, better than average, average, worse,
or much worse than average.
-List the variables. Indicate whether each variable is categorical or quantitative. If the
variable is quantitative, tell the units.
(Essay)
4.8/5 (37)
Two sections of a class took the same quiz. Section A had 15 students who had a mean score of 80,
And Section B had 20 students who had a mean score of 90. Overall, what was the approximate
Mean score for all of the students on the quiz?
(Multiple Choice)
4.9/5 (31)
All students in a physical education class completed a basketball free-throw shooting
event and the highest number of shots made was 32. The next day a student who had just
transferred into the school completed the event, making 35 shots. Indicate whether adding
the new student's score to the rest of the data made each of these summary statistics
increase, decrease, or stay about the same:
a. mean
b. median
c. range
d. IQR
e. standard deviation
(Essay)
4.8/5 (42)
To determine if people's preference in dogs had changed in the recent years, organizers of a local dog show asked people
who attended the show to indicate which breed was their favorite. This information was compiled by dog breed and gender
of the people who responded. The table summarizes the responses. 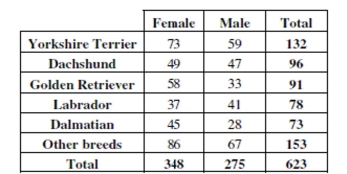 -Write a sentence or two about the conditional relative frequency distribution of the breeds
among female respondents.
-Write a sentence or two about the conditional relative frequency distribution of the breeds
among female respondents.
(Essay)
4.8/5 (47)
Which is true of the data whose distribution is shown?
I. The distribution is skewed to the right.
II. The mean is probably smaller than the median.
III. We should summarize with median and IQR. 
(Multiple Choice)
4.8/5 (27)
Cats and dogs The table shows whether students in an introductory statistics class like
dogs and/or cats. 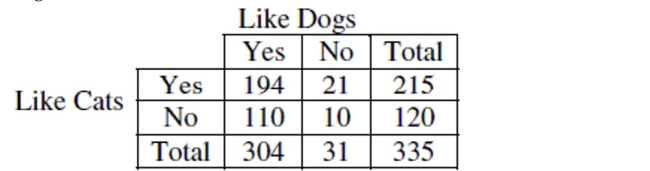 a. What is the marginal distribution (in %) of "liking dogs"?
b. What is the conditional distribution (in %) of "liking dogs" for students who like cats?
c. What kind of display(s) would you use to examine the association between "liking dogs"
and "liking cats"? (Just name a graph.)
d. Do "liking dogs" and "liking cats" appear to be independent? Give statistical evidence to
support your conclusion.
a. What is the marginal distribution (in %) of "liking dogs"?
b. What is the conditional distribution (in %) of "liking dogs" for students who like cats?
c. What kind of display(s) would you use to examine the association between "liking dogs"
and "liking cats"? (Just name a graph.)
d. Do "liking dogs" and "liking cats" appear to be independent? Give statistical evidence to
support your conclusion.
(Essay)
4.8/5 (39)
The boxplots show fuel economy of 2011 model cars for the classes shown. 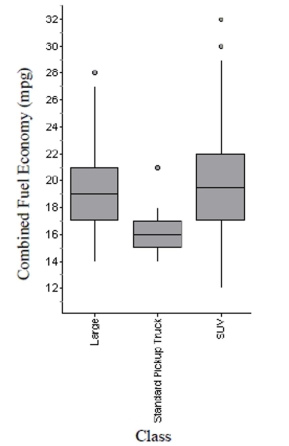 a. Which class offers the car with the best gas mileage, and what is the mileage of that car?
b. Which class has the highest median gas mileage, and how much is it?
c. Which class of car has the smallest range of fuel economy, and what is it?
d. Which class of car has the smallest IQR, and what is it?
e. Which class of car generally gets the best mileage? Explain.
a. Which class offers the car with the best gas mileage, and what is the mileage of that car?
b. Which class has the highest median gas mileage, and how much is it?
c. Which class of car has the smallest range of fuel economy, and what is it?
d. Which class of car has the smallest IQR, and what is it?
e. Which class of car generally gets the best mileage? Explain.
(Essay)
4.8/5 (35)
Suppose that a Normal model describes the acidity (pH) of rainwater, and that water tested after
Last week's storm had a z-score of 1.8. This means that the acidity of that rain …
(Multiple Choice)
4.8/5 (32)
Your Stats teacher tells you your test score was the 3rd quartile for the class. Which is true?
I. You got 75% on the test.
II. You can't really tell what this means without knowing the standard deviation.
III. You can't really tell what this means unless the class distribution is nearly Normal.
(Multiple Choice)
4.8/5 (40)
Copy machines A manufacturer claims that lifespans for their copy machines (in months) can be described by a Normal model N(42,7). Show your work.
a. Draw and clearly label the model.  b. A company with a several large office buildings buys 200 of these copiers. The salesman tells the boss "190 (95%) of your new copiers will last between _____ and _____ months."
Comment on this claim.
c. What is the 3rd quartile of copier lifespans?
d. What percent of the copiers are expected to fail before 36 months?
e. The manufacturer wants to reduce the 36-month failure rate to only 10%. Assuming the mean lifespan will stay the same, what standard deviation must they achieve?
f. Briefly explain what that change in standard deviation means in this context.
g. A competing manufacturer says that not only will 90% of their copiers last at least 36 months, 65% will last at least 42 months. What Normal model parameters is that manufacturer claiming? Show your work.
b. A company with a several large office buildings buys 200 of these copiers. The salesman tells the boss "190 (95%) of your new copiers will last between _____ and _____ months."
Comment on this claim.
c. What is the 3rd quartile of copier lifespans?
d. What percent of the copiers are expected to fail before 36 months?
e. The manufacturer wants to reduce the 36-month failure rate to only 10%. Assuming the mean lifespan will stay the same, what standard deviation must they achieve?
f. Briefly explain what that change in standard deviation means in this context.
g. A competing manufacturer says that not only will 90% of their copiers last at least 36 months, 65% will last at least 42 months. What Normal model parameters is that manufacturer claiming? Show your work.
(Essay)
4.9/5 (35)
In order to plan transportation and parking needs at a private high school, administrators asked students how they get to school. Some rode a school bus, some rode in with parents or friends, and others used "personal" transportation skateboards, or just walked. The table summarizes the responses from boys and girls.  -Identify the variables and tell whether each is categorical or quantitative.
(Essay)
4.8/5 (43)
We might choose to display data with a stemplot rather than a boxplot because a stemplot
I. reveals the shape of the distribution.
II. is better for large data sets.
III. displays the actual data.
(Multiple Choice)
4.8/5 (34)
A company's manufacturing process uses 500 gallons of water at a time. A "scrubbing" machine then removes most of a chemical pollutant before pumping the water into a nearby lake. Legally the treated water should contain no more than 80 parts per million of the chemical, but the machine isn't perfect and it is costly to operate. Since there's a fine if the discharged water exceeds the legal maximum, the company sets the machine to attain an average of 75 ppm for the batches of water treated. They believe the machine's output
can be described by a Normal model with standard deviation 4.2 ppm. (SHOW WORK)
a. What percent of the batches of water discharged exceed the 80ppm standard?
b. The company's lawyers insist that they not have more than 2% of the water over the limit. To what mean value should the company set the scrubbing machine? Assume the standard deviation does not change.
c. Because achieving a mean that low would raise the costs too much, they decide to leave the mean set at 75 ppm and try to reduce the standard deviation to achieve the "only 2% over" goal. Find the new standard deviation needed.
d. Explain what achieving a smaller standard deviation means in this context.
(Essay)
4.8/5 (42)
The lifespans of a particular brand of graphing calculator are approximately normally
distributed with a mean of 620 days from the purchase date and a standard deviation of 82
days. They will provide a warranty that guarantees a replacement if the calculator stops
working within the specified time frame, and are trying to decide what time frame to use.
a. If the company sets the warranty at a year and a half (say 540 days), what proportion of
calculators will they have to replace?
b. The company does not want to have to replace more than 1% of the calculators they sell.
What length of time should they set for the warranty?
c. The company would like to set the warranty for 540 days, and still replace no more than
1% of the calculators sold. Increasing the average life of the calculators is too expensive, but
they think they reduce the standard deviation of the lifespans. What standard deviation of
lifespans would be needed to make this happen?
d. Explain what achieving a smaller standard deviation means in this context.
(Essay)
4.8/5 (38)
Soft drinks A restaurant owner wanted to improve the efficiency of his employees. One way he tried to do this was to buy a machine that will automatically dispense 16 oz. of soda into a glass rather than have the employee hold the button on the dispenser. The actual amount dispensed by the machine can be represented by the model N(16.2, 0.3)
a. Draw and clearly label the model.  b. The sales representative who sold him the machine said, "95% of the glasses you fill with soda will fall between _________ and _________." Fill in the blanks based on the normal model, then comment on this claim.
c. What is the 3rd quartile of amounts dispensed?
d. If a glass will actually hold 16.7 oz. of soda, what percent of the time would you expect the glass to overflow?
e. The manufacturer wants to reduce the overflow rate to only 1%. Assuming the mean amount dispensed will stay the same, what standard deviation must they achieve?
f. Briefly explain what that change in standard deviation means in this context.
g. A competing manufacturer says that not only will 98% of their glasses be safe from overflowing, but 70% will have more than 16 oz., reducing customer complaints. What Normal model parameters is that manufacturer claiming? Show your work.
b. The sales representative who sold him the machine said, "95% of the glasses you fill with soda will fall between _________ and _________." Fill in the blanks based on the normal model, then comment on this claim.
c. What is the 3rd quartile of amounts dispensed?
d. If a glass will actually hold 16.7 oz. of soda, what percent of the time would you expect the glass to overflow?
e. The manufacturer wants to reduce the overflow rate to only 1%. Assuming the mean amount dispensed will stay the same, what standard deviation must they achieve?
f. Briefly explain what that change in standard deviation means in this context.
g. A competing manufacturer says that not only will 98% of their glasses be safe from overflowing, but 70% will have more than 16 oz., reducing customer complaints. What Normal model parameters is that manufacturer claiming? Show your work.
(Essay)
5.0/5 (45)
The standard deviation of the data displayed in this dotplot is closest to… 
(Multiple Choice)
4.8/5 (42)
Filters
- Essay(0)
- Multiple Choice(0)
- Short Answer(0)
- True False(0)
- Matching(0)