Exam 1: Exploring and Understanding Data
Exam 1: Exploring and Understanding Data125 Questions
Exam 2: Exploring Relationships Between Variables165 Questions
Exam 3: Gathering Data111 Questions
Exam 4: Randomness and Probability148 Questions
Exam 5: From the Data at Hand to the World at Large128 Questions
Exam 6: Accessing Associations Between Variables93 Questions
Exam 7: Inference When Variables Are Related25 Questions
Exam 8: Regression, Associations, and Predictive Modeling792 Questions
Select questions type
Has the percentage of young girls drinking milk changed over time? The following table is consistent with the results from "Beverage Choices of Young Females: Changes and Impact on Nutrient Intakes" (Shanthy A. Bowman, Journal of the American Dietetic Association, 102(9), pp. 1234-1239):  -Consider the following pie charts of the a subset of the data above:
  Do the pie charts above indicate that milk consumption by young girls is independent of the nationwide survey year? Explain.
(Essay)
4.9/5  (37)
(37)
Consider the following part of a data set: Age (years) Sex Only child? Height (inches) Weight (pounds) Credit Hours GPA Major 21 Female Yes 67.00 140.0 16 3.60 animal science 20 Female No 62.00 130.0 18 3.86 biology 28 Female No 64.00 188.0 21 3.25 psychology 21 Male No 65.00 140.0 15 2.95 psychology 24 Female No 67.00 130.0 20 3.00 anthropology 22 Male Yes 68.00 135.0 15 2.94 journalism
List the variables in the data set. Indicate whether each variable is treated as categorical or
quantitative in this data set. If the variable is quantitative, state the units.
(Essay)
4.8/5 (30)
The standard deviation of the data displayed in this dotplot is most likely to be … 
(Multiple Choice)
4.8/5 (39)
In order to plan transportation and parking needs at a private high school, administrators asked students how they get to school. Some rode a school bus, some rode in with parents or friends, and others used "personal" transportation - bikes, skateboards, or just walked. The table summarizes the responses from boys and girls.  -Write a sentence or two about the conditional relative frequency distribution of modes of transportation for the boys.
(Essay)
4.9/5 (35)
The five-number summary for the weights (in pounds) of fish caught in a bass tournament
is: Min Q1 Median Q3 Max 2.3 2.8 3.0 3.3 4.5
a. Would you expect the mean weight of all fish caught to be higher or lower than the
median? Explain.
b. You caught 3 bass weighing 2.3 pounds, 3.9 pounds, and 4.2 pounds. Were any of your
fish outliers (according to the original statistics above)? Explain.
(Essay)
4.9/5 (34)
Adult female Dalmatians weigh an average of 50 pounds with a standard deviation of 3.3
pounds. Adult female Boxers weigh an average of 57.5 pounds with a standard deviation
of 1.7 pounds. One statistics teacher owns an underweight Dalmatian and an underweight
Boxer. The Dalmatian weighs 45 pounds, and the Boxer weighs 52 pounds. Which dog is
more underweight? Explain.
(Essay)
4.8/5 (45)
Has the percentage of young girls drinking milk changed over time? The following table is consistent with the results from
"Beverage Choices of Young Females: Changes and Impact on Nutrient Intakes" (Shanthy A. Bowman, Journal of the American
Dietetic Association, 102(9), pp. 1234-1239): 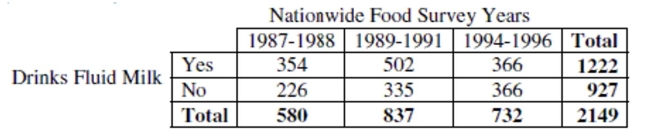 -Do you think that milk consumption by young girls is independent of the nationwide
survey year? Use statistics to justify your reasoning.
-Do you think that milk consumption by young girls is independent of the nationwide
survey year? Use statistics to justify your reasoning.
(Essay)
4.9/5 (43)
In November 2003 Discover published an article on the colonies of ants. They reported some basic information about many species of ants and the results of some discoveries found by myrmecologist Walter Tschinkel of the University of Florida. Information included the scientific name of the ant species, the geographic location, the depth of the nest (in feet), the number
of chambers in the nest, and the number of ants in the colony. The article documented how new ant colonies begin, the ant-nest design, and how nests differ in shape, number, size of chambers, and how they are connected, depending on the species. It reported that nest designs include vertical, horizontal, or inclined tunnels for movement and transport of food and ants.
-List the variables. Indicate whether each variable is categorical or quantitative. If the variable is quantitative, tell the units.
(Essay)
5.0/5 (39)
Exercising Owners of an exercise gym believe that a Normal model is useful in projecting
the number of clients who will exercise in their gym each week. They use a mean of 800
clients and a standard deviation of 90 clients.
a. Draw and clearly label this model. ![Exercising Owners of an exercise gym believe that a Normal model is useful in projecting the number of clients who will exercise in their gym each week. They use a mean of 800 clients and a standard deviation of 90 clients. a. Draw and clearly label this model. b. What is the first quartile of the weekly number of clients? [Show work] c. An owner of another gym reports that 5% of the time their gym has fewer than 450 clients, and 40% of the time the gym has more than 1085 clients. What parameters should that owner use for his Normal model?](https://storage.examlex.com/TB3452/11eb44f6_4f5d_4c48_84a5_d595b734b7a3_TB3452_00.jpg) b. What is the first quartile of the weekly number of clients? [Show work]
c. An owner of another gym reports that 5% of the time their gym has fewer than 450
clients, and 40% of the time the gym has more than 1085 clients. What parameters should
that owner use for his Normal model?
b. What is the first quartile of the weekly number of clients? [Show work]
c. An owner of another gym reports that 5% of the time their gym has fewer than 450
clients, and 40% of the time the gym has more than 1085 clients. What parameters should
that owner use for his Normal model?
(Essay)
4.9/5 (31)
In July 2013, the Federal Drug Administration approved a new version of a drug used to treat opium dependence. The old version of the drug had received complaints about a bitter taste, an aftertaste, and that it took a long time to dissolve. The goal of the new version was to get more patients to take the drug as prescribed by addressing these issues. In addition to these improvements, experimenters monitored the existence and types of side effects of the drug.
-List the variables. Indicate whether each variable is categorical or quantitative. If the variable is quantitative, tell the units.
(Essay)
4.8/5 (33)
Which of the following variables would most likely follow a Normal model?
(Multiple Choice)
4.8/5 (44)
City planners wanted to know how many people lived in a typical housing unit so they compiled data from hundreds of forms that had been submitted in various city offices. Summary statistics are shown in the table. 2.53 people s 1.40 people min 1 Q1 1 median 2 Q3 3 10
a. Notice that the minimum occupancy and the first quartile are the same. Explain how this can be.
b. The city classifies residences housing 4 or more people as "high occupancy". Would you consider 4 occupants to be unusually high? Explain.
c. The city bases their garbage disposal fee on the occupancy level of the home or apartment. The annual fee is $40 plus $5 per person, so a single occupant pays $45 and the homes with 10 people pay a year. What is the median fee paid? And the IQR?
d. What are the mean and standard deviation of the garbage disposal fees?
(Essay)
4.7/5 (39)
In order to plan transportation and parking needs at a private high school, administrators asked students how they get to
school. Some rode a school bus, some rode in with parents or friends, and others used "personal" transportation - bikes,
skateboards, or just walked. The table summarizes the responses from boys and girls.  -Find each percent.
a) What percent of the students are girls who ride the bus?
b) What percent of the girls ride the bus?
c) What percent of the bus riders are girls?
-Find each percent.
a) What percent of the students are girls who ride the bus?
b) What percent of the girls ride the bus?
c) What percent of the bus riders are girls?
(Essay)
4.7/5 (33)
Suppose that the student taking 22 credit hours in the data set was actually taking 28 credit
hours instead of 22 (so we would replace the 22 in the data set with 28). Indicate whether
changing the number of credit hours for that student would make each of the following
summary statistics increase, decrease, or stay about the same:
a. mean
b. median
c. range
d. IQR
e. standard deviation
(Essay)
4.7/5 (34)
Environmental researchers have collected rain acidity data for several decades. They want to see if
There is any evidence that attempts to reduce industrial pollution have produced a trend toward
Less acidic rainfall. They should display their data in a(n)…
(Multiple Choice)
4.8/5 (38)
Which is true of the data shown in the histogram?  I. The distribution is skewed to the right.
II) The mean is probably smaller than the median.
III) We should use median and IQR to summarize these data.
I. The distribution is skewed to the right.
II) The mean is probably smaller than the median.
III) We should use median and IQR to summarize these data.
(Multiple Choice)
4.8/5 (32)
On Monday, a class of students took a big test, and the highest score was 92. The next day, a student who had been absent made up the test, scoring 100. Indicate whether adding that student's score to the rest of the data made each of these summary statistics increase, decrease, or stay about the same:
a. mean
b. median
c. range
d. IQR
e. standard deviation
(Essay)
4.9/5 (40)
Auto insurance The Insurance Institute for Highway Safety publishes ratings for all
models of vehicles to compare the relative risk of payouts. 100 is the mean rating for all
vehicles. A rating of 122 means the vehicle is 22% worse than average. The table at the
right shows the summary statistics for the collision ratings of 27 midsize cars. Min 57 Q1 99 Median 109 Q3 122 Max 173 Mean 110.9 SD 23.99
a. Were any of the ratings outliers? Show how you made your decision.
b. A histogram of the data is shown. Is it more appropriate to use the mean and standard
deviation, or the median and IQR to describe these data? Explain. 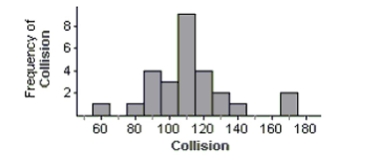
(Essay)
4.9/5 (33)
Which type of plot would be most appropriate to display the responses to type of residence?
(Multiple Choice)
4.8/5 (24)
Owners of a minor league baseball team believe that a Normal model is useful in projecting the number of fans who will attend home games. They use a mean of 8500 fans and a standard deviation of 1500 fans. Draw and clearly label this model. 
(Essay)
4.8/5 (40)
Filters
- Essay(0)
- Multiple Choice(0)
- Short Answer(0)
- True False(0)
- Matching(0)